Small Area Estimation Programme
Small Area Estimation Programme. Dr Alison Whitworth. Outline. History of SAE at ONS Small Area Statistics Problem Successful ONS experiences on Small Area Estimation SAE and Census Transformation Best use of administrative sources Lessons learned and challenges.

Small Area Estimation Programme
E N D
Presentation Transcript
Small Area Estimation Programme Dr Alison Whitworth
Outline • History of SAE at ONS • Small Area Statistics Problem • Successful ONS experiences on Small Area Estimation • SAE and Census Transformation • Best use of administrative sources • Lessons learned and challenges
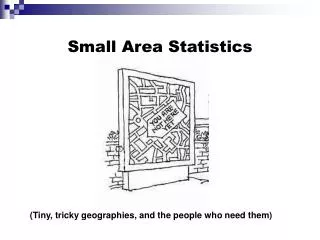
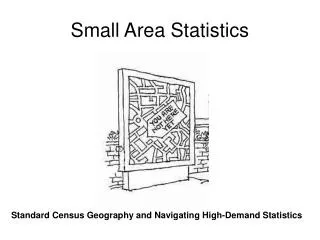
Small Area Statistics Problem Requirement for: • Comprehensive, timely and reliable information • Data for detailed geographical areas or subcategories But • Financial and operational constraints • Pressure to reduce survey sample sizes and respondent burden Solution! Borrow information from other related datasets • from similar areas, previous occasions
Borrowing strength • Small area estimation methods: • Use statistical models that relate the survey data with auxiliary information (borrow strength) • Auxiliary information: administrative data or census data available for all areas/domains • Modelling procedure • Variable of interest -> survey data • (Dependent variable) • Independent variables -> auxiliary data (covariates) • Model based estimates: • predicted values used for obtaining area/domain estimates
Successful ONS experiences • Small Area Estimation at ONS begun as a research project in 1990s • Small Area Estimation Project (SAEP), 1998 • EURAREA, 2001-2004 • Applications: • Unemployment (GB)– annual LAD and PCA estimates updated quarterly • Mean Income (E&W) – ward/MSOA estimates 98/99, 01/02, 04/05 and 07/08 • Census – 2001 One Number Census, 2011
Mean household weekly income • SAEP method (Heady et al. 2003) • Estimates for Middle layer Super Output Area (MSOA) • Survey data: Family Resources Survey (clustered household sample survey) • Auxiliary data: Social benefit claimants, Income tax, data, council tax banding, Census variables …. • Linear regression model for log income • Uses unit level response and area level covariates
2011-2012 Official model-based MSOA estimates (England and Wales) 95% Confidence Intervals for net income, equivalised, after housing costs
Limitations of the ONS current approach (SAEP) for household income • Only allows for estimation of mean household income in each MSOA • User requirement for mean and percentiles estimates at lower level geographies
Research in progress in the SAE Unit Examples : • Estimation of Household Income Distribution for 2001 and 2011 Using the Empirical Best Predictor (EBP) Method • Population Estimates by Local Authority and Ethnic Group Using Generalised Structure Preserving Estimators (GSPREE)
Example 1: Household Income using EBP approach • Empirical Best Predictor (Molina and Rao, 2010) • Estimation of mean and percentiles of income and poverty measures under one framework • Unit level model (household & area level covariates) • Involves prediction of income for each household in the population • Requires access to household level census data in addition to survey data (non-census years?)
2001 EBP estimates North West and South East regions of England Income Distribution across four different MSOAs
Coefficients of variation for income for five percentiles of the population 2001 EBP estimates North West and South East regions of England
Conclusions • EBP approach seems promising • MSOA estimates of income distribution and poverty measures under one methodology Still more questions! • How to apply EBP approach in non-census years
Example 2: Population by Ethnic Group using GSPREE • Motivation: • National Statistician’s recommendation: make the best use of all available data in the production of population statistics. • Governments ambition: Censuses after 2021 be conducted using other sources of data… • Census Transformation programme Research the potential use of administrative data and surveys to produce population, household and characteristic information currently provided in a Census. Generalise Structure Preserving Estimation (GSPREE) 14
Census Table Population by Local Authority and Ethnic Group
Data for Ethnic Group • 2011 Census estimates (Mar 2011) • Proxy: Detailed cross tabulation but outdated • School Census (Jan2014) • Proxy: Detailed cross tabulation but age 5-15 only • Annual Population Survey (2014) • Total population by ethnic group • Mid Year Population Estimates (2014) • Total population by local authority
Solution… • Combine administrative and census data with survey data to borrow strength and produce reliable estimate for each cell (domain) using GSPREE (Zhang and Chambers, 2004 and Luna-Hernandez, A, 2014).
Distribution of LA estimates by ethnic group, 2014 (England)
RMSE. LA by ethnic group, 2014 Fixed Effects GSPREE estimator (England) • Overall, GSPREE is successful in providing reliable estimates for most LAs. • However, non-negligible RMSEs (and CVs) are observed in some areas
Conclusions • GSPREE shows good performance • Small bias/RMSE in most LAs • Work in progress • Validation study (1991/2001 Census) • GSPREE: 2001 Census x 2011 data (APS, MYE, ESC) • Validation: 2011 Census • Still more questions… • Modelling strategy for more detailed categories • Discuss alternatives to generate the synthetic population (bootstrap) • Consider different attributes
Academic support • Collaborative projects Structure Preserving Estimation (SPREE), • Expert advisory group Small area estimation • Funded research/ Bids e.g. NCRM • Conferences NCRM Bath (July) SAE Maastrict (Aug)
Lessons learned • Good small area estimates depend on: • adequacy of the modelling procedures + covariates with good prediction power • model validation • Challenges: • ability to master the complexities of the required statistical theory • availability of relevant administrative/auxiliary data • capacity to overcome barriers for the acceptance of model based estimates as official statistics outputs
References Molina, I. and Rao, J. N. K. (2010). Small area estimation of poverty indicators. The Canadian Journal of Statistics 38, 369-385 Purcell, N. J. and Kish, L. (1980). Postcensal Estimates for Local Areas (or Domains). International Statistical Review, 48, 3-18. Zhang, L.C. and Chambers, R. (2004). Small area estimates for cross-classifications. Journal of the Royal Statistical Society, B, 66, 479–496. Luna-Hernandez, A. (2014). On Small Area Estimation for Compositions Using Structure Preserving Models. Unpublished PhD upgrade document, Department of Social Statistics and Demography, University of Southampton.