Download
1 / 5
50 likes | 153 Vues
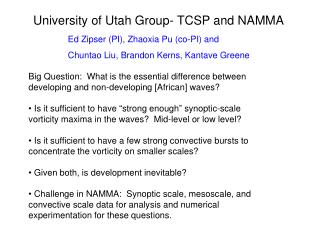
This research by the University of Utah’s TCSP and NAMMA explores the essential criteria that distinguish developing from non-developing African waves. Key questions include whether strong synoptic-scale vorticity maxima alone are sufficient for development, and the role of convective bursts on vorticity concentration. Analyzing synoptic, mesoscale, and convective scale data from June to October from 1998 to 2001, the study seeks to unravel the nuances of vorticity behavior and its implications for weather systems in the Cape Verde region.

E N D
University of Utah Group- TCSP and NAMMA Ed Zipser (PI), Zhaoxia Pu (co-PI) and Chuntao Liu, Brandon Kerns, Kantave Greene Big Question: What is the essential difference between developing and non-developing [African] waves? • Is it sufficient to have “strong enough” synoptic-scale vorticity maxima in the waves? Mid-level or low level? • Is it sufficient to have a few strong convective bursts to concentrate the vorticity on smaller scales? • Given both, is development inevitable? • Challenge in NAMMA: Synoptic scale, mesoscale, and convective scale data for analysis and numerical experimentation for these questions.
All non-developing vorticity maxima, Jun-Oct.1998-2001, mid-levels (700/600 hPa) (Colors represent relative vorticity (x 10-6s-1) ERA40, 1.125° X All non-developing vorticity maxima, Jun-Oct.1998-2001, low-levels (925/850 hPa) (Colors represent relative vorticity (x 10-6s-1) ERA40, 1.125° X Message: No shortage of waves with substantial vorticity passing north and south of Cape Verdes at both low and mid-levels; (mid-level centers are often farther north)
All developing vorticity maxima, Jun-Oct.1998-2001, mid-levels (700/600 hPa) (Colors represent relative vorticity (x 10-6s-1) ERA40, 1.125° X All developing vorticity maxima, Jun-Oct.1998-2001, low-levels (925/850 hPa) (Colors represent relative vorticity (x 10-6s-1) ERA40, 1.125° X Message: Almost all developing systems will pass south of Cape Verdes, even at mid-levels. (This is not conventional wisdom-- is ERA40 getting it right?)
All non-developing vorticity maxima, Jun-Oct.1998-2001, low-levels (925/850 hPa) (Colors represent relative vorticity (x 10-6s-1) ERA40, 1.125° X All developing vorticity maxima, Jun-Oct.1998-2001, low-levels (925/850 hPa) (Colors represent relative vorticity (x 10-6s-1) ERA40, 1.125° X Message: Most systems weaken in longitude of Cape Verdes, except for a small fraction of systems passing to the south. What distinguishes the successful ones?