Download
1 / 14
150 likes | 501 Vues
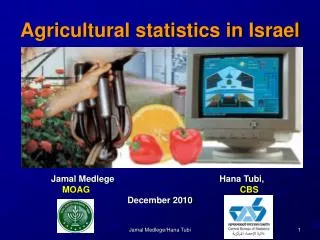
Agricultural statistics in Israel. Jamal Medlege Hana Tubi , MOAG CBS December 2010. overview. The Israeli agriculture plays a significant role as the major food supplier for the local market.

E N D
Agricultural statistics in Israel Jamal MedlegeHanaTubi, MOAG CBS December 2010 Jamal Medlege/Hana Tubi
overview • The Israeli agriculture plays a significant role as the major food supplier for the local market. • Total agricultural produce in 2009 accounted for 1.8 % of the GDP (150 billion $) . • Around 70,000 people were directly employed in agriculture in 2009 (2.6% of the country’s total labor force). • In the early 1950s, one full-time agricultural employee supplied food for 17 people, compared to 100 people in 2009 Jamal Medlege/Hana Tubi
Number of active farms Jamal Medlege/Hana Tubi
Agricultural data collection • Wholesale prices – Daily • Export/import data – Monthly • Agricultural area – annually • Economic agricultural account – annually • Agricultural census - planned in 2012 (last one in 1981, a comprehensive survey 1995)- Jamal Medlege/Hana Tubi
Annual data collection • Crop areas • Crop production • Livestock (heads) • Animal production • Fishery (mainly aquaculture) • Labour force • Income and investment Jamal Medlege/Hana Tubi
Agriculture area surveyThe Goal: Collection of updated reliable data regarding agricultural area and activities: • Area Balance (orchards, flowers, vegetables, field crops, grazing) animal inventories (cattle, chicken… • Marketing and quotas by regions (milk, chicken, eggs and fish) Jamal Medlege/Hana Tubi
Benefits • Reliable and updated information • Long-term planning • Trend Analysis • Database for research • Allocation limited resources • Prevent market failure Jamal Medlege/Hana Tubi
Common Problems for DataCollection regarding Areas • Missing data regarding farms that are not included in the administrative files • Biased reporting • Missing data regarding small farms • Missing data regarding the activity location • Missing data regarding the non-agricultural activities • Farm structure and typology Jamal Medlege/Hana Tubi
Challenges in Agriculture Statistics • Privatization and decentralization of organizations in the agriculture sector • Cooperation problems • Time limits • Shift to administrative sources with uncertain reliability • Missing Marketing data • Geographic information system • Protected crops (covered crops) • Lack of funds Jamal Medlege/Hana Tubi
Census Procedures • Define a minimum threshold for farms • Build a new farm register • Build questionnaire • Collect data • Analyze data • Publish report Jamal Medlege/Hana Tubi
Expected challenge (census aspects) • Establish a new farm register • Identify partial income from agriculture activity (business register) • Define minimum level income determination (production?) • Deduct double counting (cooperatives and partnerships) • Locate non reporting small farms Jamal Medlege/Hana Tubi
Expected difficulties (harmonization aspects) • Harmonize Data according to international standards. • Include the services component in the E.A.A (economic agriculture account) Jamal Medlege/Hana Tubi
Agri-Environmental Indicators • A new initiative of the CBS and MOAG • Develop new indicators - for some of them data are available • Examples include: • Pesticides • Nitrogen balance • Water use • Energy use • Farm management practices