Download
1 / 18
190 likes | 238 Vues
NeuraTool is a new business assessment tool providing in-depth, broad-view insights based on customer input. NeuraMetrics helps companies improve processes with continuous customer feedback, enhancing customer loyalty and satisfaction to stay competitive in the market.

E N D
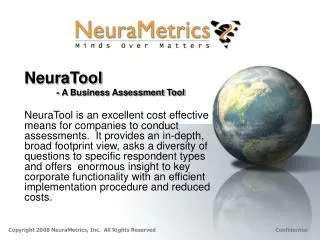
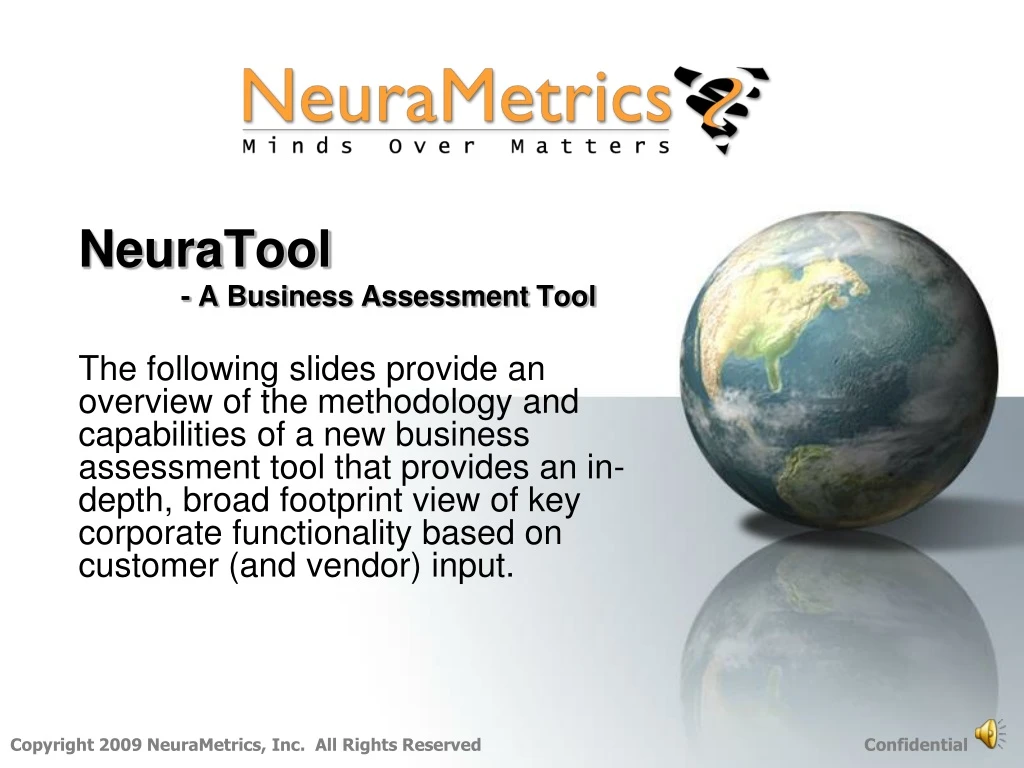
NeuraTool - A Business Assessment Tool The following slides provide an overview of the methodology and capabilities of a new business assessment tool that provides an in-depth, broad footprint view of key corporate functionality based on customer (and vendor) input.
NeuraMetrics- The market • Did you know that during economic times like this, Customer Loyalty, more than perhaps any other single factor, is what keeps customers coming back (or drives them away!)? • NeuraMetrics can help you react quicker to changes in customer needs, perceptions, and behaviors which will give you a huge advantage to stay vital and stand out ahead of the competition in this economy. • You can survive (even thrive in) a recession if you have the ability to be very nimble.
NeuraMetrics- The plan • It's critical to get inside and stay inside the hearts and minds of your customers. • You are uniquely suited to win in this environment if you stay connected to your customers. • By getting feedback, you not only gain critical information to help you adapt quickly to changes in customers' perceptions about your business, but you also can stay one step ahead of your competition.
NeuraMetrics- Keep their pulse - Keep their business • The closer you are to your customers - the more you're seeking their feedback and answering their questions - the more likely they are to turn to you when they need the products or services you offer. • Customers will see you as someone they have a relationship with - someone who cares about their needs, appreciates their hardships, and wants to know what they think. • In difficult times in the economy, customers would much rather buy from a business that they have a good relationship with than from one they don't.
Explore Corrective Strategies based on customer Input NeuraMetrics- What We Do NeuraMetrics helps corporations improve their business processes so they can deal with customer dissatisfaction. This application allows a company to survey their customers/patrons’ satisfaction with their products/services. NeuraTool is able to roll the information gathered into true business intelligence capable of providing on-line real time insight into your organization and prioritizing areas for improvement.
NeuraMetrics- Drip Intelligence Keeps Business Flowing What is Drip Intelligence? Don't wait to do an annual survey to find out which key indicators are affecting your business this month or this quarter. In this kind of economy, it's more important to be getting a constant flow of customer feedback. It's called "drip intelligence" and it gives you customer feedback on a regular basis. If you ask the right questions, the feedback you'll get will be easily actionable, timely, and will give you a leg up against your competition.
NeuraMetrics - Factors that Differentiate us • Collect and display information on a continuous basis • Display information on a respondent type basis • Relate information to different attributes of your process • Prioritize information for remedial activity • Prioritize according to attributes you select • Unlimited views of the information • Instant aggregation of opinions • Benchmarking capability • Results have statistical significance • Option to include and display a variety of respondents (Vendors & Mystery Shoppers)
NeuraMetrics - Why Survey for Customer Satisfaction Surveys allow companies to understand their “Current Reality.” This allows a variety of remedial activities: • They can implement new solutions that bring them closer to their customers’ needs and desires. • They can address identified gaps against specific customer perceptions. Correction of these weaknesses will lead to improved business outcomes. • They can identify strengths that can be used for strategic advantage against the competition. • They can baseline against internal standards or benchmark against identified trends.
NeuraMetrics - How We Do It • NeuraMetrics displays the query results in a lucid and insightful manner via a sophisticated Analysis Engine. Response data is quantified for easy benchmarking. • Data collected is instantly available to management for continuous monitoring. Survey NeuraMap
1 Use NeuraTool to Form Strategic Impressions and Identify Gaps in reality vs perceptions Use NeuraTool to Identify Specific Areas of Customer Dissatisfaction Explore Corrective Strategies based on customer Input Use NeuraTool to Help Prioritize Corrective Activity to satisfy customer needs NeuraMetrics- Using Satisfaction Survey Results 2 3 Continuously Assess to Confirm Efficacy of Corrections 4 5
Analysis - A Site Map to NeuraTool NeuraTool features vivid displays that allow insightful overview as well as great detail and extensive demographic cuts.
Extensive demographics of Respondent base Questions Key Category Overall Score Thumbnails of other demographic cuts Custom selections (cuts) using Boolean operators are easily constructed and saved for reference Summary Chart (1) - The Big Picture The Summary Chart is one of several analysis tools for “big picture” analysis. This chart shows what your customers are thinking in one complete view of your company. The scored questions & categories are nested in a radial configuration for easy reference. Color coding allows the user to quickly form strategic impressions and improvement concepts. Thumbnails of any demographic cut or other analysis maps can be saved in the periphery for easy reference.
Summary Chart (2) - Extensive Details are a Click Away Instant Mini-Report contains details on questions and scored responses By hovering the cursor over any element of the Summary Chart, the user will see a popup window that contains a detailed description of the question. By clicking on the chart element, the user can call up a “Mini-Report” that contains the scores of the questions that make up the category, distribution of the answers and the respondent count. A further capability allows the user to set custom color thresholds for all charts. “Pop Ups” on Cursor Hover Color Thresholds can be set by User
Opportunities Concepts Chart - Determine Areas of Potential Strategic Advantage and Prioritize Improvement Opportunities The Opportunity Concepts Chart presents all Questions in terms of their survey score and their importance to the company. Questions that score high and are important should be explored as areas of potential leverage or strategic advantage. Questions that score low and are important should be explored as areas of prioritized improvement. Average scoring Questions that are of low importance should receive deferred consideration. This chart allows management to focus on channeling investment into areas that have the largest potential for immediate and significant improvement for the organization. Focus here for Strengths to leverage Questions Strengths Less Important More Important Y Axis - Best Practice Score from Assessment Survey Weaknesses Focus here for Critical Improvement Opportunities X Axis – Best Practice Importance determined by Experts
Questions or, Categories This could be any entity within the demographic tree Side by side comparison of scores is possible Multi-Use Matrix - Compare Multiple Entities on Multiple Issues The MUM Chart allows comparison of a set of scores for several demographic cuts. It is excellent for comparing Entity scores in select performance areas. This chart has the advantage of allowing multiple entities to be shown at the same time. It allows direct comparison of Category or Question scores for all key areas of the organization. It allows management to replicate successes.
Other Charts - A Variety of Charts Allow Detailed Analysis The Gap Chart allows comparison of a single score for many demographic cuts. It is excellent for comparing Entity scores in discrete performance areas. It is often used to find “pockets of excellence” for specific analysis items. This chart has the advantage of allowing any number of entities to be shown at the same time. However, it is limited to a single survey element. Note that new analysis items can be selected directly from the Survey Tree. The Multiple Choice Summary contains a Survey Tree of all multiple choice questions. A histogram of the responses for the selected demographic cut is displayed. A similar chart allows the display of Open-ended questions. In both cases, the user can select any question and any demographic cut. The Radar Chart allows scores of multiple Entities to be displayed for multiple survey items. Both Demographic and Survey items are user selectable. This chart is good for both overview and drill down comparisons. The Hayes Chart allows the direct comparison of Demographic Entities on selectable scales derived from key attributes relating to Question success factors. These attributes can be customized into an unlimited number of clustered survey questions which can be used as axes on the chart. This display helps frame strategic issues and compares Entities on various measures of effectiveness. All Custom Indices can be saved for use in future analysis sessions.
Thank You for Your Interest NeuraMetrics builds survey products that use our methodology to assess Customer Perceptions and Satisfaction with your products and services. We continuously relate the results of these surveys directly to the attributes that drive business health.