Download

1 / 22
220 likes | 341 Vues
This project evaluates the transportation of hazardous materials (HazMat) across North Carolina, focusing on route optimization to mitigate risks in populated areas and near critical facilities. With over 2.2 billion tons of HazMat transported yearly and thousands of incidents reported, strategic route planning is crucial for public safety. This study, in collaboration with the State Hazardous Materials Task Force, assesses population density, potential spill impacts, and alternative routing using advanced network analysis. The anticipated results aim to enhance safety for emergency planners while balancing economic considerations.

E N D
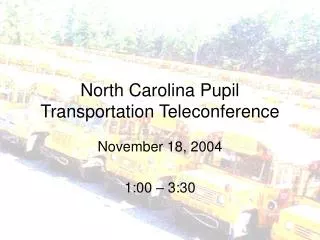
North Carolina Hazardous Materials Transportation Route Optimization Shelby Rushing The Pennsylvania State University GEOG 596A Spring 2014 Advisor: Dr. Patrick Kennelly
Introduction • 2.2 billion tons of HazMat transported each year in the U.S. • 15,424 incidents in 2012 • Risk increases in highly populated areas and around critical facilities • Thoughtful route planning reduces risk
Regulations • Chemical transport routes not regulated • Exception: Certain tunnels • Radioactive material routes are regulated • Voluntary compliancehelps companies avoid negative publicity
Cost/Benefit • Route planning must balance economic and safety concerns • Longer routes add cost • Shorter routes may increase population exposure risk • Optimal routes must consider both cost and safety
Project Background • IEM has partnered with the State Hazardous Materials Task Force since 2009 • Produced statewide hazard profiles for use by Local Emergency Planning Committees (LEPCs) • Data collection and hazard identification
Data Collection Methods • “Clicker Counts” • High costs, limited sample size • Limited value • Collect data directly from manufacturers • Produce linear features for aggregated shipment volumes and routes
Next Phase – Risk Assessment • Formal risk assessments in major metro areas • Review hazard mitigation options with local officials • 2013 Pilot in Wake County (Raleigh area) • Upcoming phase will cover Cumberland, Johnston, and New Hanover counties
Risk Assessment Objectives • Examine potential impact of spills on: • Populations • Critical facilities • Suggest alternate routes using Network Analyst • Use protective action buffers
Critical Facilities at Risk • Plot critical facilities on map • Overlay transportation corridor buffer zones • Tally number of facilities that fall within each buffer • Use facility buffers in network analysis
Route Optimization With optimization Without optimization
Anticipated Results • Many current routes will not be optimal • Maps with additional travel time vs. reduced exposure potential • Potential exposure numbers by city, county, and region • Useful to LEPCs, responders, emergency planners, and zoning boards
Schedule • Data collection: May 2014 • Analysis/Development: June-July 2014 • Submit Report: August 2014