
Success Rates of Electrode Sets in Simulated Movement Analysis
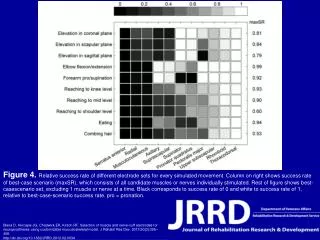
This figure illustrates the relative success rates of various electrode sets for each simulated movement. The right column presents the success rate under the best-case scenario (maxSR), where all candidate muscles or nerves are stimulated independently. The remaining sections depict variations of the best-case scenario, excluding one muscle or nerve at a time. The color gradient represents the success rates, with black indicating a success rate of 0 and white indicating a success rate of 1, relative to the maximum success rate.

Success Rates of Electrode Sets in Simulated Movement Analysis
E N D
Presentation Transcript
Figure 4. Relative success rate of different electrode sets for every simulated movement. Column on right shows success rate of best-case scenario (maxSR), which consists of all candidate muscles or nerves individually stimulated. Rest of figure shows best-casescenario set, excluding 1 muscle or nerve at a time. Black corresponds to success rate of 0 and white to success rate of 1, relative to best-case-scenario success rate. pro = pronation. Blana D, Hincapie JG, Chadwick EK, Kirsch RF. Selection of muscle and nerve-cuff electrodes for neuroprostheses using customizable musculoskeletal model. J Rehabil Res Dev. 2013;50(3):395–408.http://dx.doi.org/10.1682/JRRD.2012.02.0034