Download
1 / 12
140 likes | 624 Vues
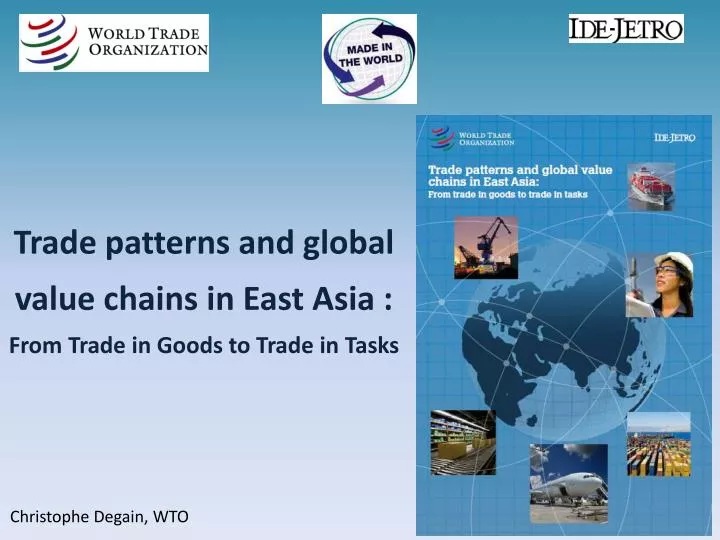
Trade patterns and global value chains in East Asia : From Trade in Goods to Trade in Tasks. Christophe Degain, WTO. Global production chains – Ins and outs. International consumer demand. Emergence of “ Trade in tasks ”:. Lower applied tariffs and trade policy incentives.

E N D
Trade patterns and global value chains in East Asia : From Trade in Goods to Trade in Tasks Christophe Degain, WTO
Global production chains – Ins and outs International consumer demand Emergence of “Trade in tasks”: Lower applied tariffs and trade policy incentives • Predominancyof trade in intermediate goods • Development of intra-firm trade • Increase of processing trade Global production chains and world trade Development of infrastructure and technological progress Export processing zones Outsourcing and offshoring strategies and FDI Need for new statistical measures of international trade
Asian economies have relatively low applied tariffs on imports (especially on semi-processed goods) Source: WTO
Export processing zones account for about 20% of total merchandise exports of developing economies (2006 or most recent year) : economies with EPZs Sources: ILO & WTO
Asia is the most attractive FDI destination in the developing regions (Billions of US$) Source: UNCTAD
Intermediate goods dominate world non-fuel merchandise exports • Key facts on Asia trade in intermediate goods … • Asia’s share in world exports of intermediate goods increases : 35% in 2009 • Intra-Asian trade is predominant • Asia imports more intermediate goods than it exports • Intermediate goods traded by Asian economies are more and more sophisticated • More and more concentrated trade on few components Billions of US$ • … Confirming that: • Asia is the “World manufacturer” • Asian supply chains boost the regional markets • Asian economies present a high degree of industrial specialization 2009 value Source: UNSD & WTO
Fragmentation of production: the example of the Boeing 787 Dreamliner Made in the world Source: Meng & Miroudot
Towards a new measure of international trade • Traditional statistics present some biases: • Multi-counting of trade flows in intermediate goods • Difficult attribution of the country of origin of an imported product • Measuring trade in value added terms allows: • To circumvent the biases observed with traditional statistics • To take into account the specificity of trade occurring between the different actors of a production chain
Some benefits of trade in value added • A better evaluation of the actual contribution of international trade to an economy (incl. development, employment, environment) • To highlight the interdependency of economies, and the counter-productive effects of protectionist measures on economies and enterprises they are supposed to protect • Better evaluation of the contribution of the services sector on trade • To provide a more realistic evaluation of bilateral trade balances and regional trade
Computers and electronic equipmentexports and their domestic and imported contents (in billions of $ and percentage) Source: WTO, based on IDE-JETRO Asian Input-Output tables
2009 US trade balance in iPhones (in millions of US$) Source: Meng and Miroudot, based on Xing and Detert (2010)
United States-China trade balanceTraditional vsVA measure (in billions of US$) Sources: UN ComtradeDatabase, IDE-JETRO AIO table and WTO estimates