Integrated Research Limited FY2012 Financial Results Overview & Growth Strategies
Integrated Research Limited (IR) is a leading global provider of performance management solutions for Unified Communications, Payments, and IT Infrastructure. In FY2012, we reported significant financial achievements, including a 15% increase in new license sales, total revenue growth of 9%, and a 21% rise in net profit after tax. Our scalable and flexible Prognosis solutions have enhanced technology performance, while our investments in R&D and key markets, including the Americas and APAC, position us for continued success. We are committed to driving growth through innovative products and expanding our global presence.

Integrated Research Limited FY2012 Financial Results Overview & Growth Strategies
E N D
Presentation Transcript
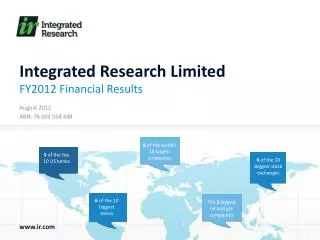
Integrated Research Limited FY2012 Financial Results August 2012 ABN: 76 003 558 449
WHO WE ARE Integrated Research IRis the leading global provider of Prognosis for performance management solutions for Unified Communications, Payments and IT Infrastructure. WHAT WE DO Capabilities Prognosis provides availability and performance management, diagnostics and insight for mission critical systems
WHY WE SUCCEED Competitive Advantage • Prognosis is real-time, scalable, extensible and flexible • Prognosis supports multiple platforms, vendors and applications • IR has 1,000 enterprise customers globally • IR has a world-class R&D capability • IR is profitable, debt-free and growing WHY CUSTOMERS BUY Value Proposition Prognosis increases technology performance, minimizes outages, reduces cost and ensures user satisfaction
FY2012 Highlights Financial Strength UC Growth • New Licence Sales $28.9m up 15% • Total Revenue $48.6m up 9% • Net Profit After Tax $9.0m up 21% • No debt • 156 new customers • Over 5.7 million phones licensed and monitored to date • Revenue up 26% Payments Growth Currency Impact • Investment in payments yields a further 32% increase in revenue • In constant currency: • New Licence Sales up 19% • Total Revenue up 13% Infrastructure • Sound result: $20.5m revenue
Financial Results • Revenue growth – 4% stronger in constant currency • Ongoing investment in R&D and Sales & Marketing • Margin* increased from 17% to 19% • * PAT/Revenue
Balance Sheet Shareholder Returns * Cash at 31 July 12: $15.9M
Review of Operations - Products • Strong growth in UC - now the Company’s highest revenue line • High Payments growth, validating investment • NonStop sales up 2% • Consultinggrowth continues *Excluding deferred revenue
Review of Operations - Regions • Americas up 25% due to strong UC sales • Europe up 6% on improved Payments sales • Growth opportunity in Asia Pacific
Growth Strategy IR Revenue Growth Trend 2001 – 2012 $ US M’s Create, sell and support Prognosis-based products and services Create new products to open new markets Deliver profitable growth from existing markets and customers
Growth Strategy – Unified Communications 1 2 3 Expansion from Voice to UC applications increases market Growth in size, complexity and criticality of networks = greater need for Performance Management UC shipments increasing – accelerated by Microsoft Lync
Growth Strategy – Payments 1 2 3 Greater Payments complexity – online, phone, cross-border … Increasing governance and regulation = Demand for Performance Management Increasing Payments transactions – fuelled by micropayments and developing economies
Growth Strategy – Global • EUROPE • Increase global share of revenue • Expand presence in Germany – focus on strong economy • APAC • Maximize fastest growing market • Open office in Singapore • AMERICAS • Maximize largest market • Develop Latin America
Growth Strategy – R&D • Maintain investment in R&D – 21% of revenue • New product development – expand vendor and application support • People – graduate program and Agile development increase R&D capability
Growth Strategy - Risks Risk and Challenges Proactive Management • Currency exchange rate movements • Global economic volatility • Hedging • Diversification of product and services • Geographic diversification • Continuous productivity improvements: • Absorbs AUD increases • Well positioned if AUD declines Source: National Australia Bank
FY2012 Summary Financial Strength UC Growth • New Licence Sales $28.9m up 15% • Total Revenue $48.6m up 9% • Net Profit After Tax $9.0m up 21% • No debt • 156 new customers • Over 5.7 million phones licensed and monitored to date • Revenue up 26% Payments Growth Currency Impact • Investment in payments yields a further 32% increase in revenue • In constant currency: • New Licence Sales up 19% • Total Revenue up 13% Infrastructure • Sound result: $20.5m revenue