Download
1 / 39
400 likes | 821 Vues
"Why software projects fail, how to diagnose potential failure, and how to make your projects succeed. With Focus on “12 Tough Questions”. By Tom Gilb Tom@Gilb.com www.Gilb.com Duration: 90 minutes Univ. of Westminster, March 11 2009, 6-8PM. 3 of 500 Sw projects Succeed.

E N D
"Why software projects fail, how to diagnose potential failure, and howto make your projects succeed.With Focus on “12 Tough Questions” By Tom GilbTom@Gilb.comwww.Gilb.com Duration: 90 minutes Univ. of Westminster, March 11 2009, 6-8PM
3 of 500 Sw projects Succeed • Letters to the Editor ("The Times"), August 19, 2002, No easy task to start IT projects • From Professor Martyn Thomas, • Sir, Your leading article (August 14) rightly focuses attention on the unacceptable rate of failure of IT projects, although contrary to what you suggest the problems are not necessarily worse in the public sector. • A survey of 1,027, mainly private sector, IT projects published in the 2001 British Computer Society Review showed that only 130 (12.7 per cent) succeeded. • Software development projects were worst: of more than 500 projects surveyed, only three were regarded as having succeeded. • As you report (Business, August 14) the problems are similar in the US. I have audited many software projects in both public and private sector organisations and in my experience the many and complex reasons for failures boil down to this : • most customers and most suppliers fail to recognise that complex software development is an engineering task. • Every step needs engineering rigour, based on sound computer science and supported by formal quality control. • Companies who work this way produce software much closer to their planned timescales and at lower cost. • Their customers are asked detailed questions to fix the requirements early in the project, and every subsequent change can be quickly analysed to see what it will cost, in money and time. • Their software contains so few errors that maintenance costs are negligible. • Most of the worldwide software industry treats software development as a craft that requires only technician-level skills. • Until that changes, projects will continue to suffer massive delays and cost overruns. • Regards,MARTYN THOMAS,Visiting Professor of Software Engineering,Oxford University Computing Laboratory,The Wolfson Building,Park Road, Oxford OX1 3QD.August 14, 2002, martyn@thomas-associates.co.uk
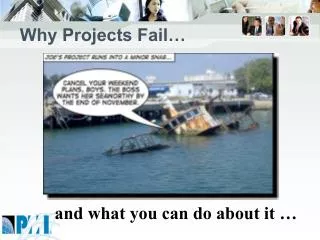
Talk Summary • •90% of all software projects, according to several surveys, are partly or totally failed. • This is due to the project management methods we have been using, mainly from the Anglo-American culture. • There are a large number of systematic causes of project failure. • This talk will list some fundamental failure causes and their cures. • It will not deal with all possible causes. • The first part is methods for diagnosing failure: knowing you are on the wrong path. • The second part is avoiding or preventing failure and • the third part is creating and controlling successful projects.
10 principles of failure analysisThings you can do to ‘sense’ failure during a project • You must decide and enforce rules of requirement specification • Rule: All quality requirements must be quantified. • You must decide the level of specification-defects (rule violations) that is acceptable • (max. 1 Major Defect/Page?) • You must focus on the top level requirements, and they must be quantified • Top 10 critical requirements: drive entire project, and can be tracked continuously • You must define key stakeholders, and their values, to derive complete requirements • 35 Key Stakeholders, 1 or more requirements each: not just ‘users’ • You must define top level strategies that measurably meet your objectives within your constraints - and estimate that they do • Top 10 strategies for meeting top requirements: estimate their numeric impact • You must prioritize early partial delivery of ‘highest stakeholder value’, first • Estimate value at each step. Choose step content with highest value of all possible steps now. • You must control costs, together with benefits, on a continuous basis • Estimate benefits/costs in weekly steps, measure benefits/costs end of week, cumulative • You must plan to measure stakeholder results on an early, frequent, and continuous basis • Spend 1 hour ±30 minutes per week to test and measure value delivered to stakeholders • You must plan to change all plans, based on current and cumulative experience feedback • Be prepared to change, requirements, designs, time estimates, cost estimates, work processes • You must plan to reward your team for benefits actually delivered - not effort. • Reward teams for actual measured required results testably delivered.
1. Why isn't the improvement quantified? 2. What is degree of the risk or uncertainty and why? 3. Are you sure? If not, why not? 4. Where did you get that from? How can I check it out? 5. How does your idea affect my goals, measurably? 6. Did we forget anything critical to survival? 7. How do you know it works that way? Did it before? 8. Have we got a complete solution? Are all objectives satisfied? 9. Are we planning to do the 'profitable things' first? 10. Who is responsible for failure or success? 11. How can we be sure the plan is working, during the project, early? 12. Is it ‘no cure, no pay’ in a contract? Why not? TWELVE TOUGH QUESTIONS There is a detailed paper on these “12 Tough Questions” at www.Gilb.com
Questions to Get Management Involvedin avoiding project failure • The 12 Tough questions • Are a way to get managers interested in metrics • The Tough Questions lead directly • to quantified management objectives • to quantified project and product requirements • to the use of impact estimation tables • For evaluating alternative solutions quantitatively
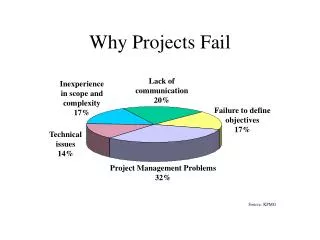
Figure 1: Real (NON-CONFIDENTIAL version) example of an initial draft of setting the objectives that engineering processes must meet. Business Objectives Quantified
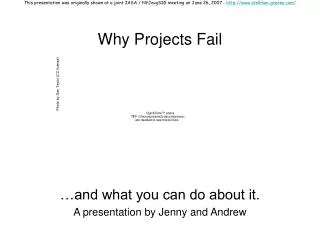
Strategy Impact Estimation Technical Strategies Objectives Strategy Impacts on Objectives Cost Benefit/Cost ratio
1. NUMBERS • Why isn’t the improvement quantified?
2. RISK • What’s degree of the risk or uncertainty and why?
3. DOUBT • Are you sure? • If not, Why not?
4. SOURCE • Where did you get that from? • How can I check it out?
5. IMPACT • How does your idea affect my goals, measurably?
6. ALL CRITICAL FACTORS • Did we forget anything critical to survival?
7. EVIDENCE • How do you know it works that way? • Did it before? "The most formidable weapon against errors of every kind is reason." --Thomas Paine "Facts are stubborn things; and whatever may be our wishes, our inclinations, or the dictates of our passions, they cannot alter the state of facts and evidence.” --John Adams (Argument in Defense of the [British] Soldiers in the Boston Massacre Trials [December 1770]
8. ENOUGH • Have we got a complete solution? • Are all objectives satisfied?
9. PROFITABILITY FIRST • Are we planning to do the profitable things first?
10. COMMITMENT • Who’s Responsible for failure or success?
11. PROOF • How can we be sure the plan is working, • during the project, • early?
12. NO CURE • Is it ‘no cure, no pay’, in the contract? • Why not? No cure No pay! See paper: No Cure No Pay (2006, Tom Gilb). Roots 2005
10 Principles of Preventing Project Failure • Keep in touch with critical stakeholders, early, continuously • Do the critical top requirements quantitatively and with rich background information (justification, authority, benchmarks etc.) • Drive majors defects per page of specs down from over 100 to <10 in six months; and then in a year or so to less than one • Make sure you have real-project time process improvement at the project level. Learn fast what works. • Measure real benefits delivered, not tasks and effort • Plan to deliver critical benefits very early, and cumulate them, and lock them in • Reward success, and punish failure, continuously and early • Give project team power to find the means; focus on controlling the results, not the means • Make sure all strategies (designs, architectures) are estimated with Impact Estimation, using evidence, uncertainty and sources. • Make sure suppliers are on an evolutionary contract, and paid by results only
1 2 4 3 5 6 7 8 The Simplest and Best Agile Project Method; ‘XE’ • Process Description • 1. Gather from all the key stakeholders the top few (5 to 20) most critical goals that the project needs to deliver. • Give each goal a reference name (a tag). • 2. For each goal, define a scale of measure and a ‘final’ goal level. • For example: Reliable: Scale: Mean Time Before Failure, Goal: 1 month. • 3. Define approximately 4 budgets for your most limited resources • (for example, time, people, money, and equipment). • 4. Write up these plans for the goals and budgets • (Try to ensure this is kept to only one page). • 5. Negotiate with the key stakeholders to formally agree the goals and budgets. • 6. Plan to deliver some benefit • (that is, progress towards the goals) • in weekly (or shorter) increments (Evo steps). • 7. Implement the project in Evo steps. • Report to project sponsors after each Evo step (weekly, or shorter) with your best available estimates or measures, for each performance goal and each resource budget. • On a single page, summarize the progress to date towards achieving the goals and the costs incurred. • 8. When all Goals are reached: ‘Claim success and move on’ • a. Free remaining resources for more profitable ventures
Agile project Management; XE Policy • Policy • The project manager, and the project, will be judged exclusively on • the relationship of progress towards achieving the goals • versus the amounts of the budgets used. • The project team will do anything legal and ethical to deliver the goal levels within the budgets. • The team will be paid and rewarded for • benefits delivered • in relation to cost. • The team will find their own work process and their own design. • As experience dictates, the team will be free to suggest to the project sponsors (stakeholders) adjustments to ‘more realistic levels’ of the goals and budgets.
10 Principles for Project Success.How to make sure you deliver what is really valued • Keep in intimate contact with key stakeholders (weekly basis, Evo delivery) • Quantify, and verify, and keep updating - the critical few stakeholder values • Derive project requirements from the stakeholder values on the basis of • most profitable stakeholder values • are supported by specific project requirements • Build systems evolutionarily, using existing systems and environments as departure basis, for delivering results - even if longer vision is radically different. • Prove concepts and deliver real results. • Do your project from a systems engineering point of view - not a ‘programmers view’. • Plan and do all the things it takes to successfully deliver real results to real stakeholders. • Line up rewards system so that stakeholder view, management view, project view is pulling in same direction and rewarded for same thing • Teach all employees good planning and specification practices, using formal rules, formal sampling measures of rule conformance, and minimum quality level exit control: don’t even let ‘junk specs’ out your process door! • Avoid all pressure in the direction of bureaucratic development processes • (like CMM, CMMI, Waterfall Model) - focus on results. • Consider changing and improving your entire organizational climate, • a CEO Job, to be more receptive to change. • Get top management (CEO, MD, President, COO, CTO) to establish and follow up simple results oriented policy. • (no majors in specs, measurable benefits early, highest benefit to costs first. That’s all.)
Last Slide Tom@Gilb.com +47 920 66 705 +44 77 1 267 0707
Backup Slides • To answer questions • To illuminate in more detail • In case there is sudden additional time to the 30 minutes
Sensing Problems in Existing Projects • How would you know that a project is on a failure path? • Early? • Quantitative sampling of requirements specs show high Major Defect Density (like 100 majors per page) • Early Planned Evolutionary result delivery steps fail to deliver planned value, or take far more time to do so than planned. • Quantitatively? See above • Credibly? See above
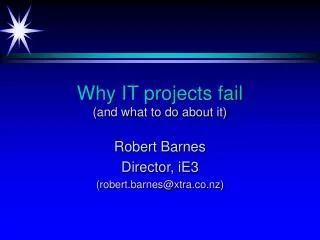
Example of Evo Step Tracking • Courtesy Trond Johansen, FIRM AS, Norway. • Paper: “From waterfall to EVO in a medium size Norwegian software house. The path and experiences”. 2004 Step 9 is a weekly step
Real Inspection of System Requirements Specification (SRS) of 82 pages. Major US Corporation. • This presentation shows how to carry out a short specification quality control with senior/middle managers. • The purpose is to • make managers aware • that they play a key-role in creating project delays • by approving poor quality of requirements documents. • The inspection results shown in this real-life example • successfully predicted a project delay of at least 2 calendar years. • Poor quality marketing requirements documents prove time and again • to be a good predictor of project delays. • The clue is that requirements documents • with a high defect density • are an indicator of a truly unprofessional engineering culture.
Framework • Demonstration of power of Inspection • 8 Managers • 2 hours • 4 real requirements specifications
“Rules”: Best Practice Strong Advice • Three Rules for Requirements: • 1. Unambiguous to intended Readership • 2. Clear enough to test. • 3. No Design specs (= ‘how to- be good’) mixed in • Mixed up in the Requirements • (Reqts. = ‘how good - to be’) not how to be good! • MARK Design as “D” • Except if it is a conscious Design Constraint (which is a requirement type) Introduce the following three rules for inspecting a requirements document:
Specification Defect Explain the definition of a Defect: • A Spec Defect is a violation of a Rule • Note: If there are 10 ambiguous terms in a single requirement • then there are 10 defects! • 9 of 10 removed, leaves 1 defect
Severity • Explain: • the definition of Major Defect • the checkers must focus on finding Major Defects • Major: a defect severity where there is potential of • high (10 lost engineering hours) loss • later downstream (test, field).
Exit? Agree with the management team on a numeric exit condition: Is 1,000 Majors per page OK? 100, 10, 1? • Exit Conditions: (when Requirements can go to Design, Test etc with little risk) • Maximum 1 Major Defect/ (Logical) Page • Logical Page = 300 Non commentary words.
The JobI gave the 8 managers(4 did page 81, 4 did page 82) • You have up to 30 minutes • for checking 1 requirements page • from an 82 page document • Count all potential Rule Violations • = Defects • Classify defects as Major or minor
Report for Page 81 (reported inspection results on requirements document, 4 managers) • 24= Total, 15=Majors, 5 = Design • 44, 15, 19 • 55, 20, 4 • 22, 4, 2 • Defect Density estimation for this page = • Total for group 20 x2 = 40 Majors assume are unique • If 33.333% effective, total in page = 3x 40=120 • Of which 2/3 or 80 were not yet found. • If we fix all we found (40), then the estimated remainder of Majors would be 80 (not found) +8 not fixed for real = 88 Majors remaining.
60 120 180 Report for page 82(reported inspection results on requirements document, 4 other managers) • Total, Majors, • Defects • M+m M Design (Design = part of Total and M&m) • --------------------------------- • 41, 24, D=1 • 33, 15, D=5 • 44, 30, D=10 • 24, 3, D=5 • Team would (we estimate) log unique Majors about 2x30=60 actually found • Which is 1/3rd of total existing , so estimated total this page is about 180 Majors • About 2/3, = 120 Majors , were not found by the team during the agile spec QC process. • Not all 180 spec defects (only 25%-35%) would actually become product defects, before testing. • We don’t know which ones in advance: it depends on human interpretation, on the day. • Many (only 25%-35%) of these Major spec defects would cause product defects (bugs in product, not just spec) • These would be found later in test,and product use as bugs or major defects • The product defect rework would cause serious project (product development) delay • No human review process is better, even when continuously improved for years, than 60% (source code record) to 88% (the ‘logic spec’ record) at defect identification. <- IBM MN. • If we attempt to fix the 60 defects we logged, and correctly fix 5/6 of them; then 10 defects are ‘failed fixes’, so: • The total remaining after inspection and editing = 10+120 =130 Majors per page. • 10 failed fixed + • 120 not detected major defects • = 130 Major defects per page ( 300 non commentary words) remaining after the review and fixing process - before text. • Conclusion: • Human defect removal by Inspections/reviews/SQC is a hopeless cause: not worth it • Spec QC can be used, in spite of imperfect effectiveness, to accurately estimate major defect level per page. • This measurement can be used to motivate engineers to dramatically (100x! Over about 7 learning cycles) reduce their defect insertion ( rule violation) to a practical exit level ( like < 1.0 Major/page)
Extrapolation toTotal Majors in Whole Document • Page 81: 120 majors/p • Page 82: 180 Majors/p • Average 150 Majors/page x 82 page = 12,300 Majors in the document. • ----------------- • If a Major has 1/3 chance of causing loss • And each loss is avg 10 hours then total project Rework cost is about 41,000 hours loss. • (This project was over a year late) • 1 year = 2,000 hour 10 people