Download
1 / 107
1.07k likes | 1.22k Vues
Dyslipidemia & Evidence-Based Medicine : What have we behind statins monotherapy?. Prof. A. Tenenbaum Director Cardioline Heart Institute Director of Research Cardiac Rehabilitation Institute, Sheba Medical Center 2010. Agenda. Dyslipidemia & Atherogenic Particles

E N D
Dyslipidemia & Evidence-Based Medicine : What have we behind statins monotherapy? Prof. A. Tenenbaum Director Cardioline Heart Institute Director of Research Cardiac Rehabilitation Institute, Sheba Medical Center 2010
Agenda Dyslipidemia & Atherogenic Particles Cholesterol Metabolism: Absorption, De Novo Synthesis and their Markers Clinical Significance of Atherogenic Dyslipidemia Beyond Statins: Clinical Evidences “Surrogate”-Endpoints Evidences Clinical “Hard”-Endpoints Evidences Summary
The basic structure of a lipoprotein. The core contains mostly lipids and the shell has a composition similar to cell membranes (protein + phospholipids + cholesterol). The shell protein molecules (apo-proteins) serve to activate surface receptors and enzymes essential for the uptake and metabolism of lipoproteins.
Relative sizes and densities of the four major lipoproteins. Chylomicrons (density < 0.95) are not shown here because of their enormous size (about 100 x the size of VLDL).
Endogenous and Exogenous Sourcesof Cholesterol Exogenous Dietary cholesterol(~300–700 mg/day) Fecal bile acids and neutral sterols Intestine Biliarycholesterol(~1000 mg/day) ~700 mg/day Liver Synthesis(~800 mg/day) Extrahepatictissues Endogenous Adapted from Champe PC, Harvey RA. Biochemistry. 2nd ed. Philadelphia: Lippincott Raven, 1994; Glew RH. In Textbook of Biochemistry with Clinical Correlations. 5th ed. New York: Wiley-Liss, 2002:728-777; Ginsberg HN, Goldberg IJ. In Harrison’s Principles of Internal Medicine. 14th ed. New York: McGraw-Hill, 1998:2138-2149; Shepherd J Eur Heart J Suppl 2001;3(suppl E):E2-E5; Hopfer U. In Textbook of Biochemistry with Clinical Correlations. 5th ed. New York: Wiley-Liss, 2002:1082-1150.
Cholesterol Metabolism: Uptake SR-BI CETP
HDL is believed to protect against atherosclerosis at least in part through the process of reverse cholesterol transport, whereby excess free cholesterol (FC) is removed from cells in peripheral tissues, such as macrophages within the arterial wall, and returned to the liver for excretion in the bile. FC is generated in part by the hydrolysis of intracellular cholesteryl ester (CE) stores. Several key molecules play a role in reverse cholesterol transport, including ATP-binding cassette protein A1 (ABCA1), lecithin:cholesterol acyltransferase (LCAT), and scavenger receptor class-B, type I (SR-BI).
Steps Involved inCholesterol Absorption 1000 mg NPC1L1 up to 700mg
Intestinal Sterol Transport In Enterocytes PL S Sterols NPC1L1 Sterols
Mechanism of Cholesterol Absorption Chylomicron Apo B 48 ABCG5/G8 ACAT NPC1L1 Protein Enterocyte Lymphatic Vessel Intestinal Lumen
EZETIMIBE Ezetimibe has specific, high affinity binding to a structural protein on the brush border Ezetimibe : Mechanism of Action CE Poor Chylomicron Apo B 48 ABCG5/G8 ACAT NPC1L1 Protein Less free cholesterol & sterol absorption X Enterocyte Lymphatic Vessel Intestinal Lumen
Cholesterol Metabolism: De Novo Synthesis www.lbqp.unb.br/.../ aulas2D/sint_de_colest.htm HMG-CoA reductase inhibitor Zymosterol Lathosterol 7-Dehydrocholesterol
Absorption and Synthesis Markers LathosterolCholestanol Synthesis Absorption • Lathosterol: is one of precursors of Cholesterol in the Mevalonate pathway thus is a marker of cholestrol synthesis. • Cholestanoland plant sterols: are positively correlated with the intestinal cholesterol (dietary plus endogenous) flux. * *Metabolism. 1989 Feb;38(2):136-40
Absorption and Synthesis Markers LathosterolCholestanol LathosterolCholestanol Ratio Bigger More Synthesis Ratio Smaller More Absorption
Patients with high cholesterol absorption presented a higher risk of MACE 2.2 fold increase p<0.01 Data from the Finnish cohort of the 4S study: Miettinen TA et al BMJ Vol 316 11 April 1998
Simvastatin Did Not Reduce Major Coronary Events in the Highest Quartiles of Cholesterol Absorption - 4S Sub-Study Placebo (n=434) Simvastatin 20-40 mg (n=434) % Major Coronary events 1 2 3 4 4.7 – 5.1 >5.1 LDL-C/ Quartile (mmol/l) <4.2 4.2 – 4.6 34% 25% 38% Relative Risk 17% Low response to simvastatin High Cholesterol Absorption Low Cholesterol Absorption 4S = Scandinavian Simvastatin Survival Study. Miettinen et al. BMJ. 1998;316:1127
Dual Inhibition concept Assman G, Kannenberg F,Weng W et al. Effects of ezetimibe, simvastatin, and ezetimibe-simvastatin on non-cholesterol sterols. Poster presented at the American Collegeof Cardiology meeting, New Orleans, Louisiana, USA, March 7–10, 2004.
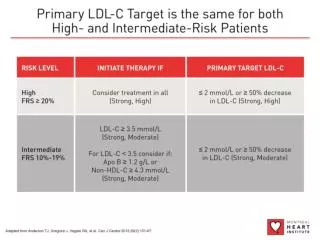
LDL-C Levels vs Events inStatin Trials: How Low to Go? Secondary prevention Primary prevention 4S-P 25 20 15 10 5 0 HPS-P Simvastatin Pravastatin Lovastatin Atorvastatin 4S-S LIPID-P % of patients with CHD event CARE-P CARE-S HPS-S WOSCOPS-P LIPID-S S=Statin; P=Placebo PROVE-IT-AT WOSCOPS-S TNT IDEAL PROVE-IT-PR AFCAPS-P AFCAPS-S ASCOT-S ASCOT-P 2.3 (90) 2.8 (110) 3.4 (130) 3.9 (150) 4.4 (170) 4.9 (190) 5.4 (210) 1.8 (70) 1.8 (30) 1.8 (50) LDL-C, mmol/L (mg/dL) Adapted from – - The Optimal low-density lipoprotein is 50 to 70 mg/dl: lower is better. O’Keefe, JR et al. J Am Coll Card. 2004; 2;43(11):2142-6
Relation Between CHD Events and LDL Cholesterol in Statin Trials PI = Placebo Rx = Treatment Primary Prevention Secondary Prevention 4S-PI 25 TNT-Entry 20 4S-Rx 15 LIPID-PI % of Paients with CHD Event CARE-PI CARE-Rx 10 WOS-PI LIPID-Rx WOS-Rx TNT 5 AFCAPS-Rx 1 AFCAPS-PI Jupiter-Pi Jupiter-Rx 0 210 50 70 90 110 130 150 170 190 LDL Cholesterol (mg/dL) AFCAPS: Lovastatin; 4S: SimvastatinWOS, LIPID, CARE: Pravastatin Kastelein. Atherosclerosis 1999;143:S17-S21
Lower LDL-C Reduces Risk for CHD 3.7 –30%CHD risk 2.9 2.2 –30 mg/dl Relative risk for CHD(log scale) 1.7 1.3 1 40 70 100 130 160 190 LDL-C (mg/dl) Adapted from Grundy SM et al Circulation 2004;110:227–239.
Multiple Studies Showed a Relationship BetweenLDL-C Reduction and CHD Relative Risk London WOSCOPS 100 Oslo CARE MRC LIPID AF/TexCAPS Los Angeles 80 Upjohn HPS LRC ALERT PROSPER NHLBI POSCH ASCOT-LLA 60 4S CARDS 40 Nonfatal MI and CHD death relative risk reduction, % 20 0 –20 15 20 25 30 35 40 LDL-C reduction, % MI = myocardial infarction. Adapted with permission from Robinson JG et al. J Am Coll Cardiol. 2005;46:1855–1862.
Relationship between LDL-C levels and change in percent atheroma volume for several IVUS trials 1.8 REVERSAL pravastatin R2 = 0.97 P<0.001 CAMELOT placebo 1.2 Median change in Percent Atheroma Volume(%) 0.6 REVERSAL atorvastatin Progression A-Plus placebo 0 Regression -0.6 ASTEROID rosuvastatin -1.2 50 80 60 70 100 110 90 120 Mean LDL-C (mg/dL) Ref: Nissen S et al. JAMA 2006; 295:
REVERSALThe Need for Intensive LDL-C Lowering: Relationship Between Degree of LDL-C Reduction and Change in Atheroma Volume 20 N=502 15 10 5 Change in atheroma volume (mm3) 0 –5 –10 –15 –80 –70 –60 –50 –40 –30 –20 –10 0 10 20 % Change in LDL-C The solid blue line indicates the relationship between mean change in LDL-C and change in atheroma volume from linear regression analysis. The dashed green lines indicate the upper and lower 95% confidence limits for the mean values. Adapted from Nissen S et al JAMA 2004;291:1071–1080.
In Israel, ~ 65% of CHD or/and Diabetic patients do not reach LDL levels < 100 mg 65.4% Clalit 4C Project Holem Study 66% LDL>100 Holem: Harats D. et al ; Dr Giluts: 4C - Computerized Community Cholesterol Control
Dual inhibition using Ezetrol and Statin provides greater Atherogenic burden relief In add on trials Vs Atrovaststin Vs Rosuvastatin
Ezetrol with Any Statin at Any Dose gives Incremental LDL-c Reduction of 25% Simva 10 mg (n=79) Eze+Simva 10 mg (n=87) Eze+Simva 20 mg (n=86) Simva 20 mg (n=89) Eze+Simva 40 mg (n=89) Simva 40 mg (n=90) Eze+Simva 80 mg (n=91) Simva 80 mg (n=87) 0 –10 –20 Mean % change from baseline to week 12 –30 –31% –35% –40 –42% –50 –46% –46%* –51%* –55%* –60 –61%* –70 *p<0.001 vs. corresponding dose of simvastatin Adapted from Goldberg AC et al. Poster presentation at the 53rd ACC, March 7–10, 2004.
More than 70% of HR Patients* Attaining NCEP ATP III LDL-C Goal w/ Eze Vs. 20% w/ statins 100 80 60 40 20 0 Placebo + statin Ezetimibe + statin 90.7 75.1 71.0 69.5 % of patients attaining goal 52.4 32.2 20.6 17.3 (n=783) (n=1584) (n=641) (n=1276) (n=121) (n=265) (n=21) (n=43) Allpatients CHD or CHD risk equivalent No CHD and <2 risk factors No CHD and <2 risk factors *Patients not at goal at baseline p<0.001 for all between-treatment differences Pearson et al. Mayo Clin. Proc. - May 2005;80(5):587-595 .
Ezetimibe/Simvastatin vs. Atorvastatin Efficacy Study 10 mg -37% Atorva 10 mg Start Dose Group EZE 10 mg + Simva 10 mg Start Dose Group EZE 10 mg + 20 mg Start Dose Group Combined EZE 10 mg + Simva Dose Groups -44% 20 mg -46%* 10/10 mg 40 mg -49% -50%* 10/20 mg 10/20 mg -50%* 80 mg -52% 10/40 mg -54%* 10/40 mg -56%* 10/80 mg -59%* * P<0.001 Week 24 Week 18 Week 12 Week 6 -35 -40 -45 Percent Reduction From Untreated Baseline in LDL-C -50 -55 -60 -65 Christie M. Ballantyne et al. Am J Cardiol 2004;93:1487–1494
Reduction in LDL-C across doses Whole MS w/o Cohort T2DM T2DM Neither 0 -10 -20 -30 % change from baseline -40 -50 -51.0 -51.6 -51.8 -54.2 -55.0 -55.6 -55.8*** -60 -58.5 All R -70 All E/S ***p<0.001 for the indicated between-treatment difference Treatment by subgroup interaction not significant, indicating treatment effect consistent with whole cohort
Proportions of patients attaining recommendedLDL-C levels of <100 and <70 mg/dL All R All R All E/S All E/S 100 91.4 88.2*** 89.0 87.9 86.8 –C <100 mg/dL 81.9 81.3 80.9 80 60 40 % patients attaining LDL 20 0 Whole T2DM MS w/o Neither Cohort T2DM <100 mg/dL† <70 mg/dL‡ 54.8 All R All R 60 All E/S All E/S 45.3*** 50 44.1 37.0 35.9 40 32.2 29.5 % patients attaining LDL–C <70 mg/dL 26.8 30 20 10 0 Whole T2DM MS w/o Neither Cohort T2DM ***p<0.001 for the indicated between-treatment difference †Treatment by subgroup interaction not significant for LDL-C <100 mg/dL, indicating treatment effect consistent with whole cohort ‡There was a statin by subgroup interaction for LDL-C <70 mg/dL (p=0.012)
Significantly Greater % Reductions in CRP Were Achieved With Eze/Simva Compared With Each Corresponding Dose of Simva Monotherapy Pearson T et al. Am J Cardiol 2007;99:1706–1713
The evolution of mankind… 2.5 mil. years 100 years
The relative risk of type 2 diabetes is clearly linked to overweight and obesity 100 93.2 80 Relative risk of type 2 diabetes 60 54.0 40.3 40 27.6 20 15.8 8.1 5.0 4.3 2.9 1.0 0 <22 22.0–22.9 23.0–23.9 24.0–24.9 25.0–26.9 27.0–28.9 29.0–30.9 31.0–32.9 33.0–34.9 35 BMI (kg/m2) Colditz et al.Ann Intern Med 1995; 122: 481-6
What is an Atherogenic lipid profile? Atherogenic triad(?): TG HDL, Small, dense LDL, Remnants Apo B48 HDL VLDL LDL Cylomicron Remnant Apo B100 Apo B100 Apo A
Risk of Major CHD Event Associated With High Insulin Levels in Nondiabetic Men Kaplan-Meier Survival Curve 1.00 0.95 0.90 0.85 0.80 0.75 0 Q1 Proportion without major CHD event Q2 Log rank: Overall P=.001 Q5 vs Q1 P<.001 Q3 Q4 Q5 0 5 10 15 20 25 Years Q1 TO Q5 = quintiles of area under the curve (AUC) insulin (Q1 = lowest quintile; Q5 = highest quintile). Pyorala M et al. Circulation 1998: 98: 398-404.
Age-adjusted rate/1000 person-years p<0.0001 Figure 1. The Bezafibrate Infarction Prevention (BIP) study primary endpoint (major cardiovascular events: combined fatal or non-fatal myocardial infarction or sudden death) in accordance with tertiles of HOMA-IR at baseline, age-adjusted rate/1000 person-years. A.Tenenbaum et al, AHJ, 2007
Metabolic syndrome A consistent relationship of metabolic syndrome with cardiovascular disease has been demonstrated Cardiovascular disease mortality 15 10 5 0 RR (95% CI), 3.55 (1.98-6.43) Metabolic Syndrome Yes No Cumulative Hazard (%) 0 2 4 6 8 10 12 Follow-up (yrs) Lakka HM et al. JAMA 2002: 288: 2709-2716.
Current therapeutic use of statins as monotherapy is still leaving many patients with metabolic syndrome and mixed atherogenic dyslipidemia at high risk for coronary events.
Combined atherogenic dyslipidemia in metabolic syndrome and type 2 diabetes: Pharmacological options in addition to statin Nicotinic acid (or niacin) Fibrates Bile acid sequestrants CETP inhibition(Torcetrapib) Ezetimibe
Combined Primary Endpoint Baseline Triglycerides 200 mg/dl 22 20 18 39.5% 16 p=0.02 14 12 (%) 10 8 6 Placebo Bezafibrate 4 2 0 4 2 3 5 6 1 0 Time (Year) Circulation 102: 21-27, 2000