Understanding Periodic Functions, Radians, and Their Applications in Trigonometry
This article explores the fundamental concepts of periodic functions, radians, and trigonometric functions, including sine, cosine, and tangent. It defines a radian and its relationship to degrees, detailing how to convert between the two. The periodic function's characteristics, such as period and amplitude, are explained with graphical examples. Additionally, you'll find applications of these concepts in solving trigonometric equations and real-world scenarios like tide heights. Practical exercises and models enhance understanding and application.

Understanding Periodic Functions, Radians, and Their Applications in Trigonometry
E N D
Presentation Transcript
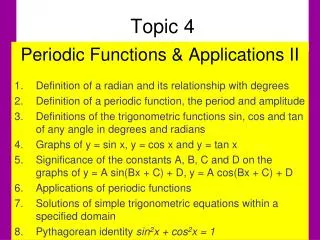
Topic 4 Periodic Functions & Applications II Definition of a radian and its relationship with degrees Definition of a periodic function, the period and amplitude Definitions of the trigonometric functions sin, cos and tan of any angle in degrees and radians Graphs of y = sin x, y = cos x and y = tan x Significance of the constants A, B, C and D on the graphs of y = A sin(Bx + C) + D, y = A cos(Bx + C) + D Applications of periodic functions Solutions of simple trigonometric equations within a specified domain Pythagorean identity sin2x + cos2x = 1
Definition of a radian and its relationship to degrees Radians In the equilateral triangle, each angle is 60o r If this chord were pushed onto the circumference, r this radius would be pulled back onto the other marked radius 60
1 radian 57o18’ 2 radians 114o36’ Radians 3 radians 171o54’ radians = 180o
Radians radians = 180o /2 radians = 90o /3 radians = 60o /4 radians = 45o etc
ModelExpress the following in degrees: (a) (b) (c) Remember = 180o
ModelExpress the following in radians: (a) (b) (c) Remember = 180o
Exercise NewQ P 294 Set 8.1 Numbers 2 – 5
2. Definition of a periodic function, period and amplitude • Consider the function shown here. • A function which repeats values in this way is called a Periodic Function • The minimum time taken for it to repeat is called the Period (T). This graph has a period of 4 • The average distance between peaks and troughs is called Amplitude (A). This graph has an amplitude of 3
3. Definition of the trigonometric functions sin, cos & tan of any angle in degrees and radians Unit Circle
ModelFind the exact value of: (a) (b) (c) 45
Exercise NewQ P 307 Set 9.2 Numbers 1, 2, 8-11
The general shapes of the three major trigonometric graphs y = sin x y = cos x y = tan x
5. Significance of the constants A,B, C and D on the graphs of… y = A sinB(x + C) + D y = A cosB(x + C) + D
y = A cos B (x + C) + D A:adjusts the amplitude B: determines the period (T). This is the distance taken to complete one cycle where T = 2/B. It therefore, also determines the number of cycles between 0 and 2. C: moves the curve left and right by a distance of –C (only when B is outside the brackets) D: shifts the curve up and down the y-axis
Graph the following curves for 0 ≤ x ≤ 2 • y = 3sin(2x) • y = 2cos(½x) + 1
Exercise NewQ P 318 Set 9.4 1 - 6
Challenge question Assume that the time between successive high tides is 4 hours High tide is 4.5 m Low tide is 0.5m It was high tide at 12 midnight Find the height of the tide at 4am
Assume that the time between successive high tides is 4 hours High tide is 4.5 m Low tide is 0.5m It was high tide at 12 midnight Find the height of the tide at 4am
y = a sin b(x+c) + d Tide range = 4m a = 2 Assume that the time between successive high tides is 4 hours High tide is 4.5 m Low tide is 0.5m It was high tide at 12 midnight Find the height of the tide at 4am High tide = 4.5 d = 2.5 Period = 4 Period = 2/b b = 0.5
y = 2 sin 0.5(x+c) + 2.5 Assume that the time between successive high tides is 4 hours High tide is 4.5 m Low tide is 0.5m It was high tide at 12 midnight Find the height of the tide at 4am At the moment, high tide is at hours We need a phase shift of units to the left c =
y = 2 sin 0.5(x+) + 2.5 Assume that the time between successive high tides is 4 hours High tide is 4.5 m Low tide is 0.5m It was high tide at 12 midnight Find the height of the tide at 4am We want the height of the tide when t = 4 On GC, use 2nd Calc, value h= 1.667m
Model: The graph below shows the horizontal displacement of a pendulum from its rest position over time: (a)Find the period and amplitude of the movement. (b) Predict the displacement at 10 seconds. (c) Find all the times up to 20 sec when the displacement will be 5 cm to the right (shown as positive on the graph)
Model: The graph below shows the horizontal displacement of a pendulum from its rest position over time: (a) Find the period and amplitude of the movement. (b) Predict the displacement at 10 seconds. (c) Find all the times up to 20 sec when the displacement will be 5 cm to the right (shown as positive on the graph) Period = 4.5 - 0.5 = 4 sec
Model: The graph below shows the horizontal displacement of a pendulum from its rest position over time: (a) Find the period and amplitude of the movement. (b) Predict the displacement at 10 seconds. (c) Find all the times up to 20 sec when the displacement will be 5 cm to the right (shown as positive on the graph) Amplitude = 8
Model: The graph below shows the horizontal displacement of a pendulum from its rest position over time: (a) Find the period and amplitude of the movement. (b) Predict the displacement at 10 seconds. (c) Find all the times up to 20 sec when the displacement will be 5 cm to the right (shown as positive on the graph) Since the period = 4 sec Displacement after 10 sec should be the same as displacement after 2 sec = 5.7cm to the left
Model: The graph below shows the horizontal displacement of a pendulum from its rest position over time: (a) Find the period and amplitude of the movement. (b) Predict the displacement at 10 seconds. (c) Find all the times up to 20 sec when the displacement will be 5 cm to the right(shown as positive on the graph) Displacement= 5cm t = 1.1 5.1, 9.1, 13.1, 17.1 3.9 7.9, 11.9, 15.9, 19.9
Exercise NewQ P 179 Set 5.2 1,3
Model: Find the equation of the curve below. y = a sin b(x+c) Amplitude = 2.5
Model: Find the equation of the curve below. y = 2.5 sin b(x+c) Amplitude = 2.5 Period = 6 6 = 2/b b = /3 Period = 2/b
Model: Find the equation of the curve below. y = 2.5 sin /3(x+c) Amplitude = 2.5 Phase shift = 4 () so c = -4 Period = 6 6 = 2/b b = /3 Period = 2/b
Model: Find the equation of the curve below. y = 2.5 sin /3(x-4) Amplitude = 2.5 Phase shift = 4 () so c = -4 Period = 6 6 = 2/b b = /3 Period = 2/b
Exercise NewQ P 183 Set 5.3 1,4