Download
1 / 12
140 likes | 281 Vues
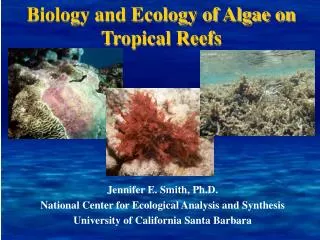
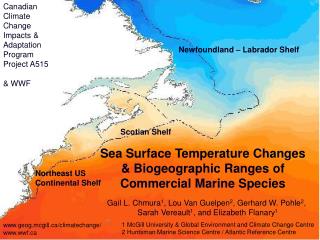
Canadian Climate Change Impacts & Adaptation Program Project A515 & WWF. Newfoundland – Labrador Shelf. Scotian Shelf. Sea Surface Temperature Changes & Biogeographic Ranges of Commercial Marine Species. Northeast US Continental Shelf.

E N D
Canadian Climate Change Impacts & Adaptation Program Project A515 & WWF Newfoundland – Labrador Shelf Scotian Shelf Sea Surface Temperature Changes & Biogeographic Ranges of Commercial Marine Species Northeast US Continental Shelf Gail L. Chmura1, Lou Van Guelpen2, Gerhard W. Pohle2,Sarah Vereault1, and Elizabeth Flanary1 1 McGill University & Global Environment and Climate Change Centre 2 Huntsman Marine Science Centre / Atlantic Reference Centre www.geog.mcgill.ca/climatechange/ www.wwf.ca
For each species the “thermal niche” or “bioclimate envelope” was determined from its geographical distribution (water depths & range in latitude) with respect to satellite-derived (AVHRR) data on sea surface temperatures. We determined the winter minimum and summer maximum. August February We determined future temperatures by adding the change image to this one.
Laminaria digitata – reported thermal niche (or range) is -2 to 22°C Plotted from temperatures reported in the literature. Plotted from temperatures derived from distribution data.
Scenarios of Forcing Factors Used – from the Intergovernmental Panel on Climate Change (IPCC) B2 forecasts low population growth and more concern for the environment A2 forecasts high population growth and less concern for the environment greater cumulative emissions of greenhouse gases (& sulphate aerosols) WWW.IPCC.ch
We used output from global circulation / global climate models – actually Atmosphere-Ocean General Circulation Models (AOGCMs) 2 periods used: 1960-1999 = baseline 2070-2099 = 4°C avg global warming Plus: 2030-2059 = 2°C avg global warming - see website New 2005
Using geospatial statistics we downscaled the coarse output of each AOGCM Hadley Centre AOGCMs vary in their number of layers and algorithms for the processes and transfers among the layers.
GFDL (US Geophysical Fluid Dynamics Laboratory) AOGCMs vary in their spatial resolution.
= - change in SSTs for that month (at the center of each pixel) avg Feb SST (or Aug) over the period 2070-2099 avg Feb SST (or Aug) over the baseline period 1960-1999
“downscaled” GFDL grid in vector format. GFDL changefield for February change in SSTs
CCCma CCSR CSIRO GFDL A2 February B2 A2 August B2 Change = 2099 minus the baseline: change in temp. Greater differences among models than between scenarios.
CCCma CCSR CSIRO GFDL A2 February B2 A2 August B2
real-time satellite data, averaged, & 9 km resolution interpolated (downscaled) change in SSTs future sea surface temperatures = + GFDL prediction for Feb SST 2079-2099. GFDL changefield for Feb February AVHRR SST