Download
1 / 60
600 likes | 767 Vues
Global Precipitation Measurement (GPM) Mission An International Partnership & Precipitation Satellite Constellation for Research on Global Water & Energy Cycle. Scientific Agenda of Global Precipitation Measurement (GPM) Mission.

E N D
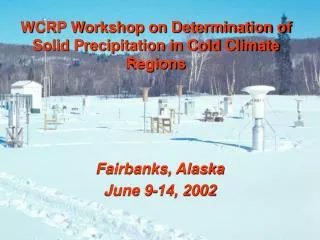
Global Precipitation Measurement (GPM) Mission An International Partnership & Precipitation Satellite Constellation for Research on Global Water & Energy Cycle Scientific Agenda of Global Precipitation Measurement (GPM) Mission • WCRP Workshop on Determination of Solid Precipitation in Cold Climate Regions • Eric A. Smith; NASA/Goddard Space Flight Center, Greenbelt, MD 20771 [tel: 301-286-5770; fax: 301-286-1626;easmith@pop900.gsfc.nasa.gov;http://gpmscience.gsfc.nasa.gov] • June 9-12, 2002; Univ. of Alaska, Fairbanks, AK
What is GPM Mission? International Set of Cooperative Satellite Missions & Associated Scientific Research-Applications Programs to Better Understand Global Water & Energy Cycle & to Obtain Improvements in Prediction of Significant Climate, Weather, & Hydrometeorological Processes -- Particularly Water Cycle Accelerations/Decelerations, Tropical Cyclones & Severe Storms, Flood Hazards, Seasonal Flood-Drought Conditions, & Stores of Fresh Water Resources NASA GPM start approved by White House, Congress, & OMB in April -- 2001 Mission Formulation phase began October -- 2001
Relevance of Global Water Cycle • Availability & quality of water is essential to life on earth. • GWC is core of climate-weather-hydrology system, affecting all physical, chemical, & ecological components & their interactions. • Accurate assessment of spatial-temporal variation of land surface water cycle is essential for addressing wide variety of socially relevant science, education, applications, & management issues: • rainfall-runoff, flood, & drought prediction • meteorological processes & weather prediction • climate system & ecosystem modeling • soil system science • crop systems & agriculture production • water supply, human health, & disease • forest ecology & management • civil engineering • water resources management • military operations • Additionally, as people increasingly modify land surface & coastal ocean, concern grows about ensuing consequences for weather, climate, water supplies, crop production, biogeochemical cycles, & ecological balances of biosphere at various time scales.
Water and Life Hydrologic Management • Water and climate • Water and food • Water quality and human health ENSO-Precipitation Links • Water and environment • Water and conflict
OBJECTIVES • Understand horizontal & vertical structure of rainfall, its macro- & micro-physical nature, & its associated latent heating • Train & calibrate retrieval algorithms for constellation radiometers • OBJECTIVES • Provide sufficient global sampling to significantly reduce uncertainties in short-term rainfall accumulations • Extend scientific and societal applications GPM Reference Concept Core Constellation • Core Satellite • TRMM-like spacecraft (NASA) • H2-A rocket launch (NASDA) • Non-sun-synchronous orbit • ~ 65° inclination • ~400 km altitude • Dual frequency radar (NASDA) • K-Ka Bands (13.6-35 GHz) • ~ 4 km horizontal resolution • ~250 m vertical resolution • Multifrequency radiometer (NASA) • 10.7, 19, 22, 37, 85, (150/183 ?) GHz V&H • Constellation Satellites • Pre-existing operational-experimental & dedicated satellites with PMW radiometers • Revisit time • 3-hour goal at ~90% of time • Sun-synch & non-sun- synch orbits • 600-900 km altitudes • Precipitation Validation Sites for Error Characterization • Select/globally distributed ground validation “Supersites” (research quality radar, up looking radiometer-radar-profiler system, raingage-disdrometer network, & T-q soundings) • Dense & frequently reporting regional raingage networks • Precipitation Processing Center • Produces global precipitation products • Products defined by GPM partners
Global Precipitation Measurement (GPM) Peaceful Use of Space:Remote Sensing for Substantive Water Management in Arid & Semi-Arid Areas United Nations Committee on Peaceful Uses of Outer Space: Science & Technical Sub-Committee Vienna, Austria Wednesday, February 27th, 2002 NASA Presentation: Global Partnerships for Global Precipitation Measurement NASDA Presentation: Success of Tropical Rainfall Measurement Mission & its Impact on Understanding Global Water Cycle
Currently Conceived Constellation Architecture Reference NPOESS-1 GPM Core (CMIS) N-GPM b DMSP-F18/20 (NPMR) (GMI / DPR) (SSMIS) E-GPM NPOESS-2 DMSP-F19 TRMM (EPMR / NPR) (CMIS) Co-Op Drone Partners Optimization and Compromise Potential New Drones/Partners (SSMIS) DMSP-F16 AQUA FY-3 NPOESS-Lite DMSP-F17 ADEOS-II (CMIS) NPOESS-3 (CPMR) (CMIS) MEGHA TROPIQUES GCOM-B1 (MADRAS) (AMSR-FO) TBD
GPM: Constellation Mission of Opportunity & Good Citizenship SatelliteMain PurposeCritical Role in Constellation 1. GPM Core GPM rain reference calibration, [NASA/NASDA] system rain radar physics, liquid/frozen precip, tropical-midlatitude sampling 2 & 3. DMSP US: NOAA/DOD met-ops & res liquid/frozen precip, [IPO] full global sampling 4. NPOESS-Lite US: NOAA/DOD met-ops & res liquid/frozen precip, [IPO] full global sampling 5. GCOM-B1 Japan: environ/hydro res liquid/frozen precip, [NASDA] & JMA met-ops full global sampling 6. E-GPM EU: cold seasons/flash flood/ rain radar physics, [ESA] data-assim res & EU met-ops liquid/frozen precip, full global sampling 7. N-GPM US: MW radiometer technology testbed liquid precip, [NASA] full global sampling 8. Megha Tropiques India/France: tropical water cycle res liquid/frozen precip, [ISRO/CNES] intensive tropical sampling 9. FY-3 China: CMA met-ops & res liquid/frozen precip, [CSM] full global sampling
Three-Year TRMM Climatology January 1998 - October 2000 N.H. Winter N.H. Spring N.H. Summer N.H. Fall
Comparing Science Agendas of TRMM & GPM • TRMM Science Focus • Generate 1st complete climatology of oceanic rainfall using high quality space-based rain measuring instruments & physics-quality retrieval algorithms. • Determine vertical structure of rainrate & associated latent heating for improved understanding of climate. • Acquire unique views and new information on hurricanes and typhoons. • Develop calibration standard for correcting 15-year old satellite rainfall record obtained from SSM/I. • Produce merger of TRMM rainfall measurements with estimates from satellite infrared observations to produce higher frequency rainfall time sampling. • Use extended rainfall datasets for global climate modeling, storm monitoring, and hydrological applications. • GPM Science Focus • Extend high quality rainfall observations to mid- & high-latitudes (i.e., > 35N). • Use microwave satellite constellation to significantly improve spatial & temporal sampling of global rainfall. • Improve accuracy & reduce uncertainty in rainfall measurements from better radar microphysics capability (i.e., size of drops, fall velocity of drops, phase of water). • Observe broader spectrum of precipitation (e.g., light/warm rain, & snow). • Extend high quality precipitation record (from TRMM onward) for detection of important trends and variations in global water cycle & climate. • Expand applications to climate change simulations, weather forecasts, fresh water resource management, flood prediction, oceanography, public outreach, & TV broadcasting. Key Ongoing & Future Components of NASA’s GWEC Initiative
Tracibility to ESE's Strategic Plan IV. What are consequences of change in Earth system for civilization? (Consequences) 1. How are variations in local weather, precipitation & water resources related to global climate variation? 2. What are consequences of land cover & use change for sustainability of ecosystems & economic productivity? 3. What are consequences of climate & sea level changes & increased human activities on coastal regions? V. How well can we predict future changes in the Earth system? (Prediction) 1. How can weather forecast duration & reliability be improved by new space obs, data assim, & modeling? 2. How well can transient climate variations be understood & predicted? 3. How well can long-term climatic trends be assessed & predicted? 4. How well can future atmospheric chemical impacts on ozone and climate be predicted? 5. How well can cycling of carbon through Earth system be modeled, & how reliable are predictions of future atmospheric concentrations of carbon dioxide & methane by these models? How is Earth changing and what are consequences for life on Earth? I. How is global Earth system changing? (Variability) 1. How are global precip, evap, & water cycling changing? 2. How is global ocean circulation varying on interannual, decadal, & longer time scales? 3. How are global ecosystems changing? 4. How is stratospheric ozone changing, as abundance of ozone-destroying chemicals decreases & new substitutes increases? 5. What changes are occurring in mass of Earth’s ice cover? 6. What are motions of Earth & its interior, & what information can be inferred about its internal processes? II. What are primary forcings of Earth system? (Forcing) 1. What trends in atmospheric constituents & solar radiation are driving global climate? 2. What changes are occurring in global land cover & land use, & what are their causes? 3. How is Earth’s surface being transformed & how can such information be used to predict future changes? III. How does Earth system respond to natural & human-induced changes? (Response) 1. What are effects of clouds & surf hydrology on climate? 2. How do ecosystems respond to & affect global environmental change & carbon cycle? 3. How can climate variations induce changes in global ocean circulation? 4. How do stratospheric trace constituents respond to change in climate & atmospheric composition? 5. How is global sea level affected by climate change? 6. What are effects of regional pollution on global atmosphere, & effects of global chemical & climate changes on regional air quality? Asrar, G., J.A. Kaye, & P. Morel, 2001: NASA Research Strategy for Earth System Science: Climate Component. Bull. Amer. Meteorol. Soc., 82, 1309-1329.
GPM Mission is Being Formulated within Context of Global Water & Energy Cycle with Foremost Science Goals Focusing On • Improved Climate Predictions:through quantifying trends & space-time variations in rainfall with associated error bars and improvements in achieving water budget closure from low to high latitudes -- plus focused GCM research on understanding relationship between rain microphysics/latent heating/DSD properties & climate variations as mediated by accompanying accelerations in global water cycle (both atmosphere & surface branches). • Improved Weather Predictions:through accurate, precise, frequent & globally distributed measurements of instantaneous rainrate & latent heat release -- plus focused NWP research on advanced techniques in satellite precipitation data assimilation & error characterization of precipitation retrievals. • Improved Hydrometeorological Predictions:through frequent sampling & complete continental coverage of high resolution rainfall measurements including snowfall -- plus focused research on innovative designs in hydrometeorological modeling encompassing hazardous flood forecasting, seasonal draught-flood outlooks, & fresh water resources prediction.
Outstanding Research Topics in Climate, Weather, & Hydrometeorological Prediction
Precipitation Prediction: Key Objective of Water Cycle Research NOW State of Art Climate Model (CCSM) GOAL Next Generation Climate Model
TRMM-retrieved Radar & Radiometer Rainfall Anomaly Time Series with MSU-retrieved ice index (DCI) (anomalies normalized by annual mean) (F.R. Robertson; GHCC)
Percent Sampling of 3-Hr Bins & Global Mean Revisit Time CORE DMSP/F18 DMSP/F19 NPOESS/Lite GCOM-B1 NGPM EGPM MEGHA-TROPIQUES FY-3 Number of Satellites
Percentage of 3-Hour Intervals Sampled in 7-Day Period Precipitation Sampling Worldwide: Constant Area Pixels GPM Era EOS Era GPM Core, DMSP-F18 & -F19, GCOM-B1, Megha-Tropiques, & Three 600-km Drones @ 34, 84, 90 Inclination TRMM, DMSP-F13, -F14, & -F15, Aqua, & ADEOS-II
Core Satellite Trade Space Analysis (Earth coverage) [ for GMI -- days to achieve 100% coverage over ±65 latitude zone ] [ for Ku- & Ka-band radars -- % coverage achieved after 7 days over ±65 latitude zone ] GMI Ku-Band Ka-Band [ 390 - 410 km altitude range / 63 - 67 deg inclination range ]
Observing Simulation System Experiment (OSSE) for Orthodox 8-Member Sun-Synchronous Constellation Producing Global 3-Hour Sampling [Flown at Two Swath Widths] Precipitation field produced by Colorado State University General Circulation Model (GCM) simulating January conditions [characteristic monthly errors order 0.25 mm day-1 or ~7 W m-2] 800 km Swath Width viz TMI 1600 km Swath Width viz SSM/I Rainfall Deviations (satellite sampled minus fully sampled in mm day-1)
Quantification & Interpretation of Required Precipitation Accuracy in Context of Tolerable Energy Flux Error
Improving Precipitation Retrievals Cloud Macrophysical & Microphysical Fundamentals Determination of: drop size distribution [DSD(r)], mass mixing ratio [q(z)hydro(r)], rain mass flux [Fr(z)], fall velocity [w(z)hydro(r) ], & latent heating [LH(z) ] q(z)hydro(r) = sw (4/3pr3) DSD(r) w(z)hydro(r) = GFO [q(z)hydro(r)] Fr(z) = ∫ q(z)hydro(r) w(z)hydro(r) dr LH(z) = C [∂ Fr(z)/∂z] RR (z) = Fr(z) / sw RFsur = RR(zsur) Dt Implementation of Fully Modular OPEN ACCESS Facility Algorithms Accompanied by COMPREHENSIVE TESTING Capability within PPS
Retrieving Bulk DSD Properties with DPR neff (0.5) w (m s-1) reff (mm) LWC (g m-3) dBZ (35 GHz) neff reff (mm) dBZ (13.6 GHz)
TRMM & GPM Rainrate Retrieval Simulations Under Varying Mean Adj Drop Diameter Profiles [ simulations based on Monte Carlo proliferation of Hurricane Bonnie observations ] TRMM Single-Frequency Algorithm (bias due to irretrievable DSD variability) GPM Dual-Frequency Algorithm (near-zero bias & reduced scatter in mid-range) R e t r i e v e d R (mm hr-1) Actual R (mm hr-1) Actual R (mm hr-1) Standard Deviation of R (%) as Function of R in mm hr-1 95% of LH spectra TRMM modal value of LH with R approximately log-normal then sR proportional to R exact variability depends on DSD variability in altitude GPM Percent ~1.5 mm hr-1 ~12.5 mm hr-1
TRMM Views Anatomy of Convective Burst Genesis of STY Damrey (West-PAC; May 7, 2000 Within center of convective burst, intense spiral rainband wraps up into nearly closed eyewall. Nascent eyewall features several “chimney clouds”, some towering to 18-19 km, & spiraling in towards center. Chimney Cloud TMI 85 GHz BURST GMS Convective burstsmay signal storm intensification. TRMM PR TMI J. B. Halverson, JCET UMBC
Impact of TMI Rain Assimilationon Tropical Cyclone Dynamics Horizontal & Vertical Winds in Tropical Cyclone Bonnie ECMWF J.-F. Mahfouf
Mid-Lat Continental Tropical Continental Tropical Oceanic Extratropical Baroclinic GPM Validation Strategy I. Basic Rainfall Validation Raingauges/Radars new/existing gauge networks new/existing radar networks Research Quality Data Confidence sanity checks II. GPM Supersites Basic Rainfall Validation hi-lo res gauge/disdrometer networks polarametric Radar system Accurate Physical Validation scientists & technicians staff data acquisition & computer facility meteorological sensor system upfacing multifreq radiometer system Do/DSD variability/vertical structure convective/stratiform partitioning GPM Satellite Data Streams Continuous Synthesis error variances precip trends Calibration Algorithm Improvements Supersite Products III. GPM Field Campaigns GPM Supersites cloud/ precip/radiation/dynamics processes GPM Alg Problem/Bias Regions targeted to specific problems FC Data Research cloud macrophysics cloud microphysics cloud-radiation modeling High Latitude Snow
Error Characterization (Accuracy) Bias (B) & Bias Uncertainty (DB) At Supersite B(RRi)tk = ∑ j = -NT/2,+NT/2 [1/(NT+1)] [ RRiSR(tj,RRi)RRiPEM(tj,RRi] B(RRi)tk end-to-end uncertainties in PEM {for i = 1 , L rainrate intervals (~5) and time period tk} Based on Physical Error Model based on: physical error model ( passive-active RTE model ) matched satellite radiometer/radar instrument on ground with continuous calibration (eyeball) independent measurements of observational inputs needed for error model (DSD profile, T-q profile, surface) All retrievals from constellation radiometers & other satellite instruments are bias- adjusted according to bias estimate from reference algorithm for core satellite.
Error Characterization (Precision) J(x) = (xb – x)TF-1 (xb – x) + ( yo – H(x))T ( O + P )-1 ( yo – H(x)) F, O, & P are error covariance matrices associated with forecast model, observations, & forward model (precip parameterization), where yo , H, & x are observation, forward model, & control variable. Space-Time Observational Error Covariance (O) At Supersite (regional expansion rule based on DPR) O(rrj,j,tj)tk = ∑ rj = 0,100 ∑ ri = 0,100.∑ j = 0,360 ∑ i = 0,360 ∑ j = -NT/2,+NT/2 ∑ i = -NT/2,+NT/2 [1/NT] [ SR(rrj,j,tj) GV(rMOD(ri+rj,100),MOD(i+j,360),ti+j) ]2 {given polar coordinates (r,) for r out to 100 km and time period tk} Space-Time Autocorrelation Structure Given By volume scanning ground radars ( dual-polarization enables DPR calibration cross-checks ) research-quality, uniformly distributed, dense, & hi-frequency sampled raingage networks
Core Satellite/GMI - DMSP/SSMIS Intersections (1-min proximity) July through December [touch resolution is 5x5 deg] Jul Oct Aug Nov Sep Dec
Percentage Global Coverage of Intersection Regions Core Satellite/GMI - DMSP/SSMIS Intersections July - August [touch resolution is 5x5 deg] (33) (49) (27) (18) (19) (30)
Floods Remain Greatest Threat to Human Life U.S. Weather Fatalities 1972-1991 Average (per year) 146 17 80 69 Mozambique Floods Flood Lighting Tornado Hurricane Piedmont Floods
brown trajectories: > 2.0 km precipitation feed green trajectories: < 1.5 km precipitation feed Barrier Convergence Zone ∑ surface flow convergence set up off-shore ∑ due to flow normal to high alps terrain ∑ flow surge lifted over convergence zone off-shore (335 qe surface) Better Flood Predictions: CRM Simulation & Microphysical Analysis of Three (3) Late Season Mediterranean Floods Elevated Mixed Layer 3 km MSL Brunt Vaisala Frequency Simulation of Low-Level Flows within Tyrrhenian, Ligurian, Ionian, & Adriatic Seas white (surface) -- orange (1.5 km) Amplifying Mesoscale Storms Arising within Mobile Westerly Disturbances under Control of Fixed Geography & Orography 35/50 m s-1 jet cores; 5 km MSL isobars (2 mb); surface temperature Surging EML ==> Inflow Cross-Section Surface qe (shaded) Stable Brünt-Vaisala Frequency (dark shading) 427 mm Piemonte - 2000 Friuli - 1998 Genova - 1992
Example for Weather Prediction Cloud Resolving Model Simulations from UW-NMS for Establishing Cloud-Radiation Relationships Lake-Effects Roll Convection Explicit Convection in Hurricane Bonnie Middle-Latitude Cyclone Supercell Thunderstorm Alps Orographic-Convective Storm
The Frozen Precipitation Problem From a GPM Perspective
Analysis of River Runoff Uncertainty Use of Distributed Runoff Fields Generated from Observed Discharge to Assess Precipitation Bias Precipitation estimates from Global Precipitation Climatology Project (GPCP) can be assessed using integrated system of observed & modeled runoff estimates (Fekete, Vorosmarty, Grabs; WMO Report #22). Comparisons highlight spatial patterns of potential bias in precipitation estimates & therefore water budget closure. Integrated ground-based monitoring system for discharge & co-incident runoff fields would be of substantial value to integrity of GPM rain retrievals. Distribution of GPCP-Associated Runoff Errors (C. Vorosmarty; UNH)
The Fundamental Modeling Problem 2 x 2 GPCP 0.125 x 0.125 PRISM 2 x 2 PRISM Range in Snow Cover Columbia River Basin mm Snow Energy Model Seasonal Snow Water Equivalent Lettenmaier Nijssen Wood Incoming Shortwave Radiation
CRL Dual Frequency (13.6,35 GHz)Ku-Ka Band Radar (DPR) Measurable range by 35GHz radar Measurable range by 14GHz radar DPR radar will measure intense rain in tropics and weak rain & snow in mid/ high-latitudes & DSD using differential reflectivity tropical rain mid- & high- latitude rain & snow Frequency strong rain weak rain & snow Rainrate new measurable range by addition of 35GHz radar
The Issue with Radar Sensitivity Nomalized pdf of Snow-rate Reflectivity DPR Ka-Band (35 GHz) 1 .5 0 -11 -35 -25 -15 -5 0 +5 +15 +25 +35 dBZ
Nadir-Pointing Precipitation Radar (NPR)for EGPM Mission NPR instantaneous footprints
x-z cross-section of Snowat 89.0 & 157.0 GHz Precipitating Snow 8 6 4 2 0 89 GHz z-axis (km) 60 80 100 120 140 160 180 8 6 4 2 0 157 GHz z-axis (km) 60 80 100 120 140 160 180 x-axis (km)
Dual Frequency (Ku/Ka Band) STAR Bore Sighted with GPM Core Satellite DPR Figure 4a: Left panel presents schematic of dual-frequency 14-35 GHz LRR-STAR system, bore-sighted with GPM core satellite’s DPR, while right panel presents slotted waveguide design in which two (2) sets of 14-member thinned waveguide arrays are intermeshed across single antenna frame.
Evidence that Hi Frequency MW Radiometer Channels Detect Snowfall Over Land & Ocean