Download
1 / 21
220 likes | 508 Vues
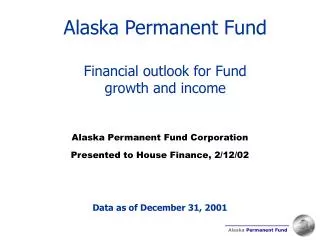
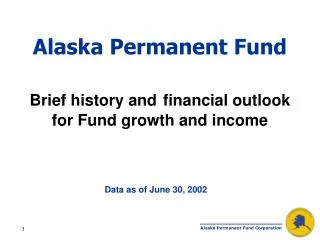
Alaska Permanent Fund Brief history and financial outlook for Fund growth and income. Data as of June 30, 2002. Permanent Fund market value 24-month change in principal and earnings reserve account. Earnings reserve. billions. Principal. Earnings reserve account

E N D
Alaska Permanent FundBrief history andfinancial outlookfor Fund growth and income Data as of June 30, 2002
Permanent Fund market value 24-month change in principal and earnings reserve account Earnings reserve billions Principal
Earnings reserve account 24-month change in realized and unrealized income • As provided by law, all Fund income is deposited in the earnings reserve account. • It is retained there until appropriatedby the legislature. Unrealized income Realized income
Earnings reserve reconciliation What happened to the $4.9 billion? $6.5 billion June 30, 2000 ERA balance - $1.3 billion 2 years of inflation-proofing transfers to principal - $2.0 billion 2 years of paying out PFDs - $1.6 billion depreciation in market value = $1.6 billion June 30, 2002 ERA balance
Fund principal sources of contributions as of June 30, 2002 The Alaska Permanent Fund principal is protected by the Alaska Constitution. The principal is not available for appropriation. Dedicatedoil revenues Inflation-proofing Special appropriations
Fund’s total return annualized for the past, recent times and the future
Staying the course Although there is a 1 in 4 chance that the Fund will earn a negative return in any single year, there is only a 1 in 20 chance that the Fund will earn a negative return over a 5-year period, and virtually no chance of a negative return over a 10-year holding period.
Range of market valueFY03 – FY08 10th billions 25th 50th 75th 90th This is a volatility graph which projects the range of likely outcomes in the future, with the extremes of the bars indicating the less likely probabilities.
Range of market valueFY03 – FY08 10th billions 25th 50th 75th 90th How to read this graph: It projects the range of possible outcomes for the current year as well as the next five, but each year assumes that the Fund achieved the median return the prior year. It is not simply an extrapolation.
Range of market valueFY03 – FY08 The top edge of the bar indicates the 90th percentile probability (that is, nine times out of ten, the results are likely to be lower than the corresponding number shown in the table below). 90th billions 75th 50th 25th 10th
Range of market valueFY03 – FY08 The top edge of the second color in the bar indicates the 75thpercentile probability (that is, three times out of four, the results are likely to be lower than the corresponding number shown in the table below). 90th billions 75th 50th 25th 10th
Range of market valueFY03 – FY08 The top edge of the third color in the bar indicates the 50thpercentile probability (that is, one-half of the time, the results are likely be lower than the corresponding number shown in the table below and one-half of the time higher). 90th billions 75th 50th 25th 10th
Range of market valueFY03 – FY08 90th billions The top edge of the lowest color in the bar indicates the 25th percentile probability (that is, three times out of four, the results are likely to be higher than the corresponding number show in the table below). 75th 50th 25th 10th
Range of market valueFY03 – FY08 90th billions The bottom edge of the bar indicates the 10th percentile probability (that is, nine times out of ten, the results will be higher than the corresponding number show in the table below). 75th 50th 25th 10th
Range of principal balanceFY03 – FY08 $ billions
Range of total earnings reserveFY03 – FY08 $ billions
Range of distributed incomeFY03 – FY08 $ billions