Download

1 / 12
120 likes | 279 Vues
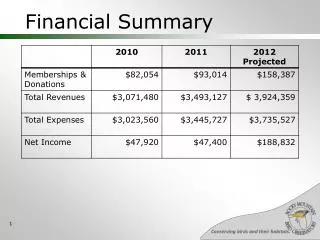
Financial Summary June 30, 2014. Bob Baden Chief Financial Officer. Statistical Summary June 30, 2014. Curr YTD Budget Average Daily Census 23.1 23.7 23.0 Occupancy % 39% 40% 39% Discharges 187 195 199 ALOS (MC/Total) 4.37/3.71 4.32/3.69 4.56/3.65

E N D
Financial SummaryJune 30, 2014 Bob Baden Chief Financial Officer
Statistical SummaryJune 30, 2014 CurrYTDBudget • Average Daily Census 23.1 23.7 23.0 • Occupancy % 39% 40% 39% • Discharges 187 195 199 • ALOS (MC/Total) 4.37/3.71 4.32/3.69 4.56/3.65 • CCC Avg Daily Census 103 101 103 • # Surgeries 207 195 214 • # Endoscopies 169 165 125 • # Deliveries 31 36 39 • # ER Visits 1,745 1,740 1,782 • # Outpatient Visits 3,627 3,481 3,415
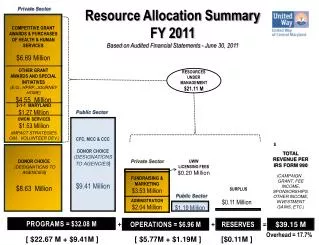
Balance Sheet Pre-Audit June 30, 2014 ASSETS CurrentPreviousChange Current Assets $ 39,425,028 $39,018,785 $ 406,243 Assets whose use is limited $ 5,462,174 $ 5,532,065 $ (69,891) Net property value $104,164,747$103,831,945$ 332,802 Total Assets $149,051,949 $148,382,795 $ 669,154
Balance SheetPre-Audit June 30, 2014 Liabilities & Fund Balances CurrentPreviousChange Current liabilities $ 12,566,740 $ 10,837,043 $ 1,729,697 Long term liabilities $101,323,524 $102,894,062 $ (1,570,538) Fund balances $ 35,161,685$ 34,651,690$ 509,995 Total liabilities & fund bal $ 149,051,949 $148,382,795 $ 669,154
Summary June 2014 June’s Inpatient Discharges at 187 decreased by 7% compared to May and fell short of budget by 6%. Inpatient Average Daily Census increased in June to 23.1 and was on budget. ALOS in June was 2% above budget and Medicare was 4% below budget. Outpatient activity at 3,627 visits was 6% above budget. The CCC average daily census at 103 was on budget for the month. Surgery cases at 207 rose by 25% compared to May yet were 3% below budget. Endoscopy procedures at 169 were 35% above budget. LVMC saw an increase in newborn deliveries in June to 31 but that was still 21% below budget. ER visits totaled 1,745 (37 visits or 2% below budget). June Pre-Audit Acute Financials show that Gross Revenue at nearly $9.7M was above budget by $1.5M or 19%. Inpatient Gross Revenue was $277K above budget and Outpatient Gross Revenue was $1.28M above budget. Patient volume increases generated Contractual Discounts over budget with Medicare and Cal OP causing $921K of the total contractual deduction overage of nearly $966K. M’Care & M’Cal OP revenue overages alone generated $886K of the total Contractual Deduction overages.
Summary June 2014 • In spite of the high deductions Net Patient Revenue exceeded budget by $593K. • Total Operating Expenses of $4.5M in June were above budget by 13% or $525K. Total Salary costs exceeded budget by $243K or 16%, ($126K in Nursing, Gen Acctg $33K, IS $19K, Cardio $14K, Patient Acctg $13K, Radiology $13K and a few other departments). Registry Costs were over $70K with most Nursing depts. involved. Physicians & Therapists (Contract Labor) was over by $59K in MRI, PT and HIM. Supply costs were over 10% due to a $63K overage in OR supplies. Purchased service costs were $101K over due to $25K for getting patient covered by Medi-Cal, $38K for Repairs & Maint., billings for external reporting $12K plus others. Other expenses were over by $44K due to physician recruiting and IGT costs. • The Operating Margin gain for June was $142K but could have been larger if operating costs were more in line with budget The bottom line gain was $222K. Year to date the operating margin is $325K positive and the bottom line is $878K positive. • The CCC Gross Revenues of $1.18M were $62K or 5% short of budget in June. Deductions of ($146K due to retroactive payments from Medi-Cal Mgd. Care) pushed the Net Patient Revenue to nearly $1.3M or $85K above budget in June. Operating Expenses exceeded budget by $79K or 8.5%. Salary costs were $50K or 9% over budget with $41K SNU, $7K Admin and $5K Dietary. Supplies were $16K over budget largely due to EVS $7K, Dietary $4K and SNU $5K. Purchased services over $9K with $4K in Admin and $5K in Maintenance. The gain from operations and bottom line gain for June was $288K and $1,874K positive on a year to date basis, due largely to the retroactive reimbursement from Medi-Cal Mgd. Care.
Summary June 2014 • The Consolidated Operating Margin results posted a $430K gain and a gain of $510K at the Increase (decrease) in Net Assets line in June, while year-to-date numbers were $2.2M positive operating margin and $2.27M positive Net Asset increase. • Total Assets and Liabilities and Fund Balance increased by $669K as of June 30, 2014. • Total Current Assets increased by $406K primarily due to a $105K increase in Cash and Gross AR by $282K net as June 30 plus a decrease of $98K in Other Receivables. Assets whose use is limited as a group declined by $70K due to a portion of capital campaign funds were used to pay down the debt on the hospital. Total Net Property, Plant and Equipment increased by $333K due to an increase in CIP of $746K for the CDRH project, Kitchen and Laundry offset by depreciation for the month of $530K. • Total Current Liabilities increased by $1.7M due primarily to moving long term debt notes amount to the current classification ($1.6M) plus increases and decreases in payables at the end of the month. The decrease in Total Liabilities ($1.6M) as of June 30 reflected the $1.6M of long term debt moved to current. The fund balance increased by nearly $510K due to the consolidated increase in net assets recorded for June 2014.
Other Finance ItemsJune 2014 Other Finance Items: • Board Resolution 295 authorizes the District to refinance the 2007 GO Bonds and is in the Finance Committee packet. • There was $6K in Medicare RAC take backs in June. No MAC activity in June. • All Medi-Cal Managed Care IGT documents have been signed and sent to the State. Estimated net gain for the District is $3,040,000 after all State and CenCal Fees are paid. Due: Late August early September. • Health Net Contract & LVMC have exchanged two proposals each. No change in Champion Center negotiations. LVMC and United Healthcare have exchanged proposals. • The Proposed FY’15 Budget is available in the Finance Committee Packet. • Our QudraMed Contract Mgt system failed in early April. Data has been loaded into the new system and is being tested before going live.