Download
1 / 39
390 likes | 523 Vues
As of March 6, 2012. THE FUTURE OF NUCLEAR POWER AFTER FUKUSHIMA. Paul L Joskow Alfred P. Sloan Foundation and MIT (Based in part on a co-authored paper with John E. Parsons MIT). The views expressed here are our own and do not necessarily reflect the views of MIT, the

E N D
As of March 6, 2012 THE FUTURE OF NUCLEAR POWER AFTER FUKUSHIMA Paul L Joskow Alfred P. Sloan Foundation and MIT (Based in part on a co-authored paper with John E. Parsons MIT) The views expressed here are our own and do not necessarily reflect the views of MIT, the Sloan Foundation or any other individual or organization with which we are affiliated.
FUKUSHIMA I (Daiici) STATS UnitCapacityDesignCommercial Operation (net MWe) 1 439 Mw GE Mark I March 1971 2 760 Mw GE Mark I July 1974 3 760 Mw GE Mark I March 1976 4 760 Mw GE Mark I October 1978 5 760 Mw GE Mark I April 1978 6 1067 Mw GE Mark II October 1979 Source: http://www.scribd.com/doc/50550192/NIRS-Fact-Sheet-on-Fukushima-Nuclear-Power-Plant and IAEA PRIS Data Base
About 160 miles from Tokyo Source: http://en.wikipedia.org/wiki/File:Japan_Nuclear_power_plants_map.gif
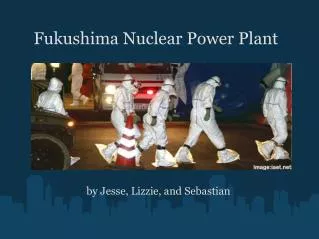
FUKUSHIMA I (Daiici) Source: INPO 11-0005, page 2 (2012)
FUKUSHIMA I (Daiici) dock Artificial harbor
Simplified Sequence of Events • March 11, 2012 at 1446 JST a 9.0 earthquake about 110 miles from Fukushima (6.5 to 7.0 at plant --- about design basis for earthquake) • Operating units 1,2,3 (unit 4 in cold shut down) automatically scram, cooling rods are inserted, off-station power is lost, and emergency generators start as planned to provide emergency AC power for cooling , monitoring and emergency equipment • March 11, 2012, at about 1527 the first of seven Tsunamis reach Fukushima • Maximum height about 49 feet, exceeding design basis of about 33 feet • On-site emergency power lost completely for core cooling and waste fuel ponds and substantial damage to site and flooding of reactor buildings • Two workers on site killed after being trapped in a building after Tsunami and at least three workers received radiation doses above criterion limits • ~20,000 people in Japan killed by Tsunami itself • Substantial destruction of building, transportation, electricity, and communications infrastructure • Various efforts to restore cooling to cores and waste fuel pools ensued • Evacuations ordered out to 2km, 3km, 10km, 20km, seek shelter out to 30km, and transport and food restrictions imposed • 17 million curies of Iodine-131 equivalent radiation released into the air between March 11 and April 5. (378.4 million curies released during Chernobyl accident) • High dose rates within the site and near site boundaries and selected “hot spots” further away. • Efforts to continue to control radiation releases and bring reactors under control proceeded for 8 months • December 16, 2012, all units declared to be in cold shut down, though not through standard methods • Cleanup estimated at 40 years and yet to be estimated direct and indirect costs many billions of dollars (TMI II cleanup was about $1 billion + replacement power for TMI 1 for several years, but little indirect economic disruption)
Various Sources 1 mrem/hr = 0.01 mSievert/hr
Initial Site Survey Source: INPO (2011)
Source: Adapted from R. Hoetzlein (c) under creative common license
http://www.rchoetzlein.com/theory/2011/fukushima-radiation-regional-effects-animation/http://www.rchoetzlein.com/theory/2011/fukushima-radiation-regional-effects-animation/
Direct Accident Consequences • Earthquake and Tsunami major causes of loss of life and property damage • Fukushima accident has resulted in large cost of property damage to plant and large plant cleanup costs. TEPCO effectively bankrupt • Dislocation costs for people evacuated and social costs for communities that still have isolated pockets of high radiation, though most people have returned if their homes are intact. Compounded by earthquake and Tsunami • Cleanup and decontamination costs for surrounding communities. 195,000 people screened and 102 decontaminated based on IAEA screening criteria • No prompt fatalities and minimal latent fatalities from radiation are likely, but the latter is uncertain • Radiation did not reach Tokyo for six days • No effects on marine life yet identified • Seriously undermined confidence in nuclear power in Japan and a few other countries • Emergency response, information dissemination, decision responsibility • Effectiveness of Japanese regulatory system and connections between government and industry • Risks of nuclear power accidents in a region prone to earthquakes and Tsunamis • What are the alternatives? • It could have been a lot worse! Tsunami way outside the design basis envelope, information confused, and response protocols chaotic.
Lessons Learned • Strong independent regulatory authority continues to be important even though nuclear accidents are not good for business • Cooperative industry peer reviews through INPO have been effective in the U.S., but less effective elsewhere (WANO) • Comprehensive emergency response systems with clear lines of authority must be defined and tested • Plant managers and on-site regulators must be given authority to respond quickly to events • Flexibility is needed to respond to events outside of the design basis accidents envelope • Defense in depth strategy based on design basis accident with a margin of safety is sound • Clear transparent protocol for providing information about the state of the accident and measured radiation doses essential. Destruction of monitoring equipment in and near site complicated response • Upgrades will be needed to reduce the possibility of a complete loss of on-site power, monitoring of fuel storage ponds, pressure release systems, and other attributes of existing plants • Design bases must be reevaluated over time as new information about earthquakes, floods and other potential accident pathways are identified and appropriate retrofits made
WORLD OPERATING NUCLEAR PLANTSBy Type BWR: 92 (U.S. 35 of which 23 Mark 1) PWR: 269 (U.S. 69) Other: 81 (47 CANDU or clones) Source IAEA (March 19, 2011, PRIS data base)
368 GW Plus 6 units in Taiwan Includes: 7 units connected in 2011 (India, Pakistan, China, Iran, Russia) 4 closed in Japan, 7 closed in Germany, 1 Magnox closed in UK Source: IAEA
INTEREST IN “NUCLEAR RENAISSANCE” • Mitigate CO2 emissions • Carbon free base load technology with a great deal of experience and high capacity factor • 20% of U.S. generation, 15% of global generation • Performance Improvements over time • Capacity factors • Safety indicia • Technological improvements (Gen 3) to improve safety and safety and reduce cost • Energy security/diversity benefits • Gain technological knowledge • Public and NGO opposition on safety grounds appeared to have dissipated
Effects on “Nuclear Renaissance” • It was unlikely that a lot of new nuclear capacity built in most OECD countries prior to Fukushima. • In OECD countries with large existing nuclear fleets the action was on life extensions and capacity uprates (South Korea and UK may be exceptions) • Fukushima helped to accelerate retirements and reduce even modest prospects of new build in Europe in several countries so “mini” hoped for nuclear renaissance in these countries will not take place • Germany • Switzerland • Italy • Spain • Belgium • Sweden (?) • France (?) • Japan is a big global player and policy choices will be important but are still uncertain. All but 2 nuclear plants were not running as of March 4, 2012 as safety issues are considered and government tries to pull its act together. Local governments oppose restarts until convinced about safety.
Effects on “Nuclear Renaissance” • No effects yet in the U.S. following initial 90-day NRC safety review, new seismic grid, and staff assessment recommendations, but potential retrofit costs could lead some plants to close earlier than anticipated especially if natural gas and wholesale power prices remain low. • “Nuclear renaissance” was concentrated in developing countries before Fukushima and that is not likely to change much as a result of Fukushima • China • India • Russia • Eastern Europe • Middle East • Turkey • Global future of nuclear driven more by economic and technical issues than safety concerns
IEA 2010 REFERENCE CASE PRE-FUKUSHIMAJuly 2010 REGION2007 Nuclear (Quads)2035 Nuclear (Quads)Growth Rate annual % OECD North America 9.6 11.3 0.6 OECD Europe 9.1 11.2 0.8 OECD Asia 3.9 7.1 2.1 OECD TOTAL22.629.51.0 Non-OECD Asia 1.2 9.8 7.7 Non-OECD Europe/Eurasia 3.0 6.3 2.7 Non-OECD Total 4.517.54.9 Source: IEA IEO (2010)
2011 Excludes 7 reactors completed in 2011 Source: IAEA, December 2011
CONSTRUCTION INITIATION YEARNUMBER DEVELOPED COUNTRIES 2 1 2005 3 1 2006 4 0 2007 7 1 2008 10 0 2009 12 0 2010 15 0 2011 2 0 Source: IAEA
U.S. LICENSE RENEWALSunits (as of 12/15/11) APPROVED 71 UNDER REVIEW 14 EXPECTED 18 Source: Nuclear Energy Institute
CALLENGES TO NUCLEAR RENAISSANCE • Nuclear is more expensive than advertised and less competitive with cheap natural gas driven by shale gas • Failure so far to price CO2 emissions • Subsidies and mandates for renewables • Deregulation of generation in about half of the U.S. and in Europe and parts of Canada • Active U.S. projects in regulated states + federal loan guarantees • Safety concerns in some countries (Europe; Japan is a big question mark) • Slower demand growth expectations • Costs of meeting new safety criteria • Costs and complexity of good safety regulatory infrastructure for countries seeking to enter nuclear power sector • Proliferation concerns • The future growth of new nuclear plants was and is primarily in developing countries creating many institutional challenges
Nuclear vs. Alternatives Joskow and Parsons, Daedalus, Fall 2009
Nuclear vs. Alternativeswith CO2 Emissions Prices Joskow and Parsons, Daedalus, Fall 2009
Natural Gas Futures Prices(Henry Hub, December 30, 2011)$/mmBtu February 2012 $2.974 June 2012 $3.182 June 2013 $3.866 June 2014 $4.241 June 2015 $4.481 June 2016 $4.732 Source: NYMEX, December 30, 2011
2008 Total Electricity Supply: 4,123 billion KWh 2035 Total Electricity Supply: 5,167 billion KWh Growth rate of electricity consumption: 1% Source: EIA Annual Energy Outlook 2011
URANIUM PRICES (U3O8) 1988-2011
UF6 PRICES 2004-2011
STATUS OF COLs FOR NEW U.S. NUCLEARUNITS(as of February 17, 2012) STATUS# of Units COL AWARDED 2 (Feb/2012) ACTIVE APPLICATIONS 6 ( 2 of which are likely soon) SCHEDULE BEING REVISED 9 SCHEDULE SUSPENDED OR NO SCHEDULE 13 [COL = combined constructions and operating license] Source: NRC, Trade Press, Press Releases
Nuclear Power and CO2 Emissions in the U.S. • Nuclear power accounts for 20% of U.S. electricity generation and has become a highly reliable dispatchable source of electricity • Most models currently assume all existing units will get 20-year life extensions, some with increases in capacity plus modest (6% to 8%) new capacity by 2035 • 2035 is a misleading year to end a forecast related to nuclear power since between 2035 and 2055 essentially all of the 20-year life extensions expire. • With little new construction a significant fraction of U.S. generating capacity that does not produce CO2 will be gone by 2050 or so. • What will replace it?