Download
1 / 42
420 likes | 558 Vues
Development of Electronic Data Reporting (EDR) in Statistics Finland. Design goals. Framework for similar systems Multi-language support User authentication / authorisation Data security (collection and production databases)

E N D
Development of Electronic Data Reporting (EDR) in Statistics Finland
Design goals • Framework for similar systems • Multi-language support • User authentication / authorisation • Data security (collection and production databases) • Simple method for transferring data between collection and production databases • “Mass emailer” for all kinds of collection systems Rami Peltola
Three generations • Building cost index 2001 • sub-annual survey • built using Microsoft Windows DNA (Distributed iNternet Application Architecture) • 6 EDR solutions 2002-2004 • both sub-annual and annual surveys • VB.NET • 4 EDR solutions 2005 • sub-annual surveys • XCola Rami Peltola
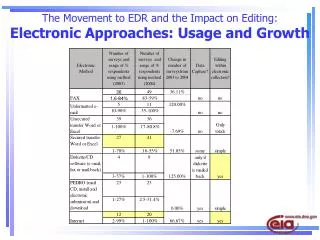
Data Provider relations and response rates: Business surveys
Background • Traditionally high response rates in annual and sub-annual business surveys • up to over 99% • persistent staff • Good relations with data providers • experienced staff • many continuous personal contacts • usually long-lasting relationships • high level of trust Rami Peltola
Infrastructure and atmosphere for EDR in Finland • High level of using the Internet • almost every enterprise has access to internet • business surveys are typically made for the largest enterprises • Positive atmosphere for using internet for transactions with the government • respondents are even enthusiastic about using Internet • “It’s fun to fill in web forms instead of paper ones!” Rami Peltola
Key issues when implementing EDR -solution • Simplifying data collection process • Reducing need for human resources • Reducing other data collection costs • Improving the quality of collected data • Decreasing non-response • Speeding up the data accumulation • Reducing response burden • Enabling direct individual feedback for respondents • Enabling browsing of previously submitted data • Assuring high level data security Cost-efficiency Accuracy Timeliness Data providerrelations Rami Peltola
Reducing response burden • Using e-mail for informing the survey and sending the reminders • link to the EDR -solution • Questionnaire is “always” available • Good designing of the questionnaire • not just a copy of the paper form • Helpful validity checks • reduce the need of additional inquiries • Contextual on-line help • Option to fill in the questionnaire in separate sessions • Support for several languages Rami Peltola
Enabling direct individual feedback for respondents (1) • Motivates respondent to use EDR -solution instead a paper form • For example enterprise’s own data compared with the data of it’s own industry • Respondents have found feedback useful • has even led to inquiries for more information Rami Peltola
Enabling direct individual feedback for respondents (2) • Monthly saleinquiry: Rami Peltola
Enabling browsing of previously submitted data • Respondent have access to all the data it has previously submitted • simple short-term (sub-annual) surveys • Pre-filling the form with data from previous surveys • useful especially in annual surveys • helps the respondent to remember how the figures were compiled last year Rami Peltola
Assuring high level data security • Data security audit by an outside consult • All traffic on the Internet is SSL -encrypted • An authentication / authorisation -process is always needed • New user IDs and passwords every year • User IDs and passwords are initially sent in a letter • only one of them can be sent by email • the other one must always be sent in a letter or given over by telephone • Only a certain number of our staff have access to user IDs and passwords (usually two persons per survey) Rami Peltola
Decreasing non-response and speeding up the accumulation of the data • Response rates have remained on high level • The average response time of monthly surveys has been reduced • in the best case by 7-8 days or 30% • The number of reminders sent has decreased substantially • in the best case by 50% • The share of the respondents using EDR -solution has in most cases reached high level • sub-annual surveys > 60% (in the best case 85%) • annual surveys ~ 30% (in the best case 50%) Rami Peltola
An example: Sale inquiry Change in response media 10/2001 - 10/2004 Rami Peltola
An example: Sale inquiry • EDR users of all respondents: • after 1. month: 48% • after 2. month: 59% • after 3. month: 61% • after 4. month: 70% • Today: > 80% Rami Peltola
An example: Sale inquiry • Reminders sent: • before EDR: ~ 1000 • after 1. month: ~ 800 • after 2. month: ~ 700 • after 3. month: ~ 600 • since 4. month: ~ 500 Rami Peltola
An example: Sale inquiry Responses per day 10/2001 (until t+45 days) Due date (accumulation 31%) Reminders (accumulation 76%) Rami Peltola
An example: Sale inquiry Responses per day 10/2002 (until t+45 days) Due date (accumulation 49%) Reminders (accumulation 81%) Rami Peltola
An example: Sale inquiry Responses per day 10/2003 (until t+45 days) Due date (accumulation 68%) Reminders (accumulation 78%) Rami Peltola
An example: Sale inquiry Responses per day 10/2004 (until t+45 days) Due date (accumulation 76%) Reminders (accumulation 86%) Rami Peltola
An example: Sale inquiry Accumulation of data 10/2001 - 10/2004 Rami Peltola
Costs of EDR • The costs of developing web-based applications and running them has dropped by 60-70% during the last three years • Average investment cost per new EDR -solution (today) • An outside service provider: EUR 5000 • In-house solution (XCola): 150 hours of work • Maintenance costs of EDR solution per year (today) • An outside service provider: EUR 1000 • In-house solution (XCola): 50 hours of work Rami Peltola
Development costs: In-house EDR solutions • The in-house solutions are already in the third generation phase • During the first and second phases the total resource input was about 2.5 person years • more or less “learning by doing” • includes the development of a secure communication environment • includes the implementation of 7 solutions • XCola (third generation phase) development took about 1 person year • includes the implementation of 4 solutions Rami Peltola
Benefits of EDR to Statistics Finland (1) • Four second generation solutions have been in production for more than year • 3300 respondents per month and 800 per quarter • Average percentage of work saved in the data collection phase is over 40 (2 person years) • The amount of ground mail has been reduced by 64 000 or 65% (0.5 person years) • The average response time has been reduced in the best case by 7-8 days or 30% • Number of reminders sent has gone down by the half • Investment has paid off in about a year Rami Peltola
Benefits of EDR to Statistics Finland (2) • The data received are of better quality • both annual and sub-annual surveys • common estimate is “25% less errors” • comprehensive study has not been made • As manual handling diminishes, it can be replaced by more rewarding tasks Rami Peltola
Benefits of EDR to respondents • Questionnaire is possible to be completed more rapidly • Pre-filling helps respondents to remember how they have answered previously • Validity checks prevent the sending of erroneous data • no additional inquiries • Same piece of information needs always to be entered only once • Respondents like to use Internet • Perceived response burden has gone down Rami Peltola
Effects of the EDR on data collection process Printing the questionnaires Transferring data to collection database Mailing E-mail informing (mass emailer) Receiving the questionnaires (mail, fax, e-mail) (Electronic data supply) Validating and entering the data On-line validations + mass validation Printing and mailing the reminders E-mail reminder (mass emailer) Phone inquiry Phone inquiry Non-individual delayed feedback Individual direct feedback Limited access to previous own data Previous own data available Manual exclusive treatment Electronic mass treatment Rami Peltola
Data transfers • Data transfers between collection and production databases are handled with an external application • Data from collection database • is first transferred to the temporary tables in the production database • and then synchronized with the actual tables • Solution is quite customizable • Easy to customize for new collection systems • Easy to add new databases Rami Peltola
Mass emailer • An external application to send emails to the respondents • Modular approach • New systems can be added using textual configuration files • Reply requests (list of e-mails) can be added by writing sql statements to the configuration files • Supports attachments • Replaces traditional letters Rami Peltola
An example: Sale inquiryBackground • Monthly inquiry using paper forms (~2080 enterprises) • Data collection process (7-8 persons: ~2.0 working years) • Printing and mailing the questionnaires • Receiving the questionnaires (mail, fax, e-mail) • Validating and entering the data • Printing and mailing the reminders • Phone inquiry • Quarterly non-individual feedback for respondents • Previously submitted data preprinted to questionnaires for the last 2 months Rami Peltola
An example: Sale inquiryPurpose • To describe the economic situation in different industries • Trade: 30 branches • Services: 23 branches • Construction: 3 branches • Manufacturing: 15 branches • To respond to EU-legislation • The Regulation of the EU concerning short-term statistics (1165/98) Rami Peltola
An example: Sale inquiry / Source data • Tax Administration’s register • Value added tax -data • Delay 2 months in turnover • The data accumulates for 6 months • Direct data collection (sale inquiry ~2080 companies) • The most largest companies from each industry • Trade: ~660 companies • Services: ~600 companies • Construction: ~200 companies • Manufacturing: ~620 companies • Business Register • Basic information about companies: branch of industry, location, contact information etc. Rami Peltola
An example: Sale inquiryEnd products • Monthly indicators (newsletters and Internet releases) • Trade: 30 (European sample), 45 (preliminary) and75 days delay • Services: 45 (European sample) and 75 days delay • Construction: 75 days delay • Manufacturing: 75 days delay • Time series • Starts mostly from 1995 (trade from 1985) Rami Peltola
Printing and mailing the questionnaires Due date Printing and mailing the reminders Phone inquiry for non-respondents Data collection process in sale inquiry before EDRCollecting the sales data concerning March Manual data entering April May Rami Peltola
Data collection process in sale inquiry todayCollecting the sales data concerning March Electronic data transfers April Transferring data to collection database Due date E-mail reminders E-mail informing 1. phone inquiry for non-respondents on European sample 2. phone inquiry for non-respondents on European sample Phone inquiry for the rest non-respondents Rami Peltola
EDR solution / Sale inquiry Rami Peltola
Change in working hours used in data collection and validation (hours per year) Rami Peltola
Hours used in development and maintenance of EDR solution (sale inquiry) Includes hours used in development of infrastrucre Rami Peltola
Experiences (1) • Feedback from respondents has been very positive: Response burden has redused remarkably • Enthusiasm of persons involved in data collection • Manual data treatment has redused (at least by 50%) • Quality of data has improved: On-line validations, additional information if data is not comparable etc. Rami Peltola
Experiences (2) • Number of enquires made by respondents concerning EDR solution: • First two months: ~100 / month (mainly questions concerning base settings) • Since third month: ~30 / month (mainly forgotten passwords) Rami Peltola
Effects of EDR on data quality (ESS quality dimensions) • Accuracy • Automatic validations • Timeliness • Mail E -mail and web • Manual data entering Electronic data transfers • Comparability Rami Peltola