Use RFM to Boost Your Response Rate
730 likes | 1.03k Vues
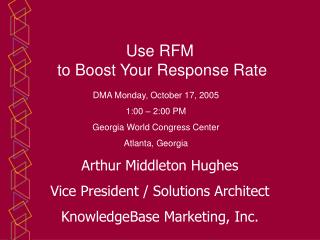
Use RFM to Boost Your Response Rate. DMA Monday, October 17, 2005 1:00 – 2:00 PM Georgia World Congress Center Atlanta, Georgia. Arthur Middleton Hughes Vice President / Solutions Architect KnowledgeBase Marketing, Inc. . How a modern database system works. Marketing Staff. Data Access

Use RFM to Boost Your Response Rate
E N D
Presentation Transcript
Use RFM to Boost Your Response Rate DMA Monday, October 17, 2005 1:00 – 2:00 PM Georgia World Congress Center Atlanta, Georgia Arthur Middleton Hughes Vice President / Solutions Architect KnowledgeBase Marketing, Inc.
How a modern database system works Marketing Staff Data Access & Analysis Software Customer Transactions Marketing Database Appended Data & Modeling Customer Service Inputs from Retail, Phone, Web Web Site
Two Kinds of Database People • Constructors People who build databases Merge/Purge, Hardware, Software • Creators People who understand strategy Build loyalty and repeat sales • You need both kinds!
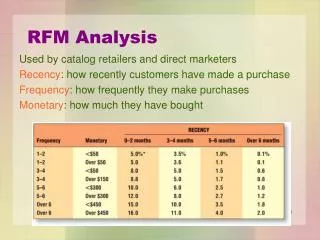
Recency Frequency Monetary (RFM) Analysis • Used for marketing to customers • Always improves response and profits • Better than any demographic model • The most powerful segmentation method
How to Apply Recency Codes • Put most recent purchase date into every customer record • Sort database by that date - newest to oldest • Divide into five equal parts - Quintiles • Assign “5” to top group, “4” to next, etc. • Put quintile number in each customer record
Responsive customers may not be the most profitable • Responsive Customers Profitable Customers RFM LTV Not all responsive customers are profitable Not all profitable customers will respond when you write them.
RFM Can Predict Responders • For product launch, select SICs with highest penetration ratios • Use RFM to select most likely responders • Use combination of mail, phone, and sales visits to responsive relationship buyers.
How to Apply Recency Codes • Put most recent purchase date into every customer record • Sort database by that date - newest to oldest • Divide into five equal parts - Quintiles • Assign “5” to top group, “4” to next, etc. • Put quintile number in each customer record
How to compute a Frequency Index • Keep number of transactions in customer record • Sort Recency Groups from highest to lowest • Divide into five equal groups • Number groups from 5 to 1 • Put Quintile number in each customer record
How to compute a Monetary Index • Store total dollars purchased in each customer record • Sort Frequency Groups from highest to lowest • Divide into 5 equal groups (Quintiles) • Number Quintiles 5, 4, 3, 2, 1 • Put Quintile number in each record
Monetary Response to $5,000 Product Percentage of households promoted who purchased 2 1.68 1.5 1.17 0.88 1 0.66 0.5 0.32 0 5 4 3 2 1 Monetary Quintile
F 5 M 35 335 4 34 334 3 33 333 332 32 2 331 31 Twenty-five sorts 1 Five Sorts Database One Sort RFM Code Construction R
Creating an Nth 300,000 Records Customer Database For Nth by 10, select every tenth record. Nth Result will be statistical replica of database 30,000 Records
How to Compute the Response Rate • Divide number of responses by number mailed. Multiply by 100 • Example: Responses = 1034 Mailed = 40,000 Rate = 1034 / 40,000 Rate = 2.59%
Retroactive RFM Test • Many times there is not enough time or funding to run an Nth test in advance • Solution: apply RFM codes to your last completed outgoing promotion. • Since you know who responded, you can determine response rates by cell • Use previous rates to govern this rollout.
How Many RFM Cells Needed? • Test File = (Test Budget) / (per piece cost) • Example = $15,000 / $0.76 = 19,737 • Cells Needed = 19,737 / 274 = 72
Cell Division Determination • To create 72 cells, some must be less than 5 • Recency most powerful. Do not scrimp. • Example R-F-M = 6 X 4 X 3 = 72 • Is this best? Test and see.
RFM For BusinessDatabases • Business databases are small • For small databases, use quartiles or thirds • Quartile = 4 X 4 X 4 = 64 Cells • Thirds = 3 X 3 X 3 = 27 Cells • Custom = 5 X 2 X 2 = 20 Cells
Recent Case History • User sells personalized product by mail • 45,000 selected for a test
WhenNOTto use RFM • If you use it all the time, half your customers will never hear from you • They will be lost • The others will suffer from File Fatigue • Use it sparingly • Product launch is ideal use
How to compute a Frequency Index • Keep number of purchases in customer record • Sort records in each recency quintile from highest to lowest • Divide into five equal groups (Quintiles) • Number quintiles from 5 to 1 • Put Quintile number in each customer record
How to compute a Monetary Index • Store total dollars purchased in each customer record • Sort the records in each frequency quintile from highest to lowest • Divide into 5 equal groups (Quintiles) • Number Quintiles 5, 4, 3, 2, 1 • Put Quintile number in each customer record
F 5 M 35 335 4 34 334 3 33 333 332 32 2 331 31 Twenty-five sorts 1 Five Sorts Database One Sort RFM Code Construction R
What is the break even rate? • Each test segment must be measured • A segment breaks even if the profit from sales exactly equals the cost of the promotion • BE = (Per Piece Cost) / (Net revenue from one sale) • BE = ($0.48) / ($28) = 1.71%