Download
1 / 32
330 likes | 514 Vues
FPGA Acceleration of Gene Rearrangement Analysis. Jason D. Bakos. Dept. of Computer Science and Engineering University of South Carolina Columbia, SC USA. Talk Outline. Application: Phylogenetic Reconstruction Gene Rearrangement Data Breakpoint Median Computation Core Architecture

E N D
FPGA Acceleration ofGene Rearrangement Analysis Jason D. Bakos Dept. of Computer Science and Engineering University of South Carolina Columbia, SC USA
Talk Outline • Application: • Phylogenetic Reconstruction • Gene Rearrangement Data • Breakpoint Median Computation • Core Architecture • Extracting Parallelism • Performance Results • Core Computation Speedup • Application Speedup • Conclusion and Future Work
Phylogenies genus Drosophila
Phylogenetic Analysis • Phylogenies are used to infer common characteristics among related species
Phylogeny Data Structure g1 g3 g4 g2 g1 g3 g2 g5 g5 g5 g6 g4 g6 • Unrooted binary tree • n leaf vertices • n - 2 internal vertices (degree 3) • Tree configurations = • (2n - 5) * (2n - 7) * (2n - 9) * … * 3 • 200 trillion trees for 16 leaves g4 g1 g6 g5 g2 g3 g5
Phylogenetic Reconstruction • Given biological data for a set of species, compute an accurate phylogeny • Distance-based Methods • Construct tree using pair-wise distances (UPGMA, neighbor-joining) • Fast but inaccurate • Maximum Parsimony Methods • Goal: Accuracy • Construct tree using evolutionary model • Search for most parsimonious tree • Candidate trees must be “scored” • All internal vertices are labeled with ancestral data • Edge distances are computed between vertex pairs and summed
GRAPPA Performance Bottleneck • GRAPPA • “Genome Rearrangement Analysis under Parsimony and other Phylogenetic Algorithms” • Exhaustive branch-and-bound or heuristic search through tree space • Labeling computation is performance bottleneck • 95+% of execution time is spent computing labels for internal vertices 1 Execution Time Ratio for Labeling 0 Diameter (Ev. Rate) of Inputs
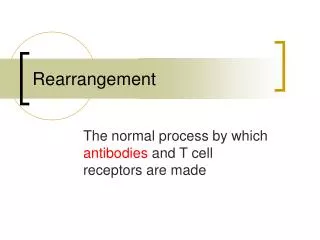
Gene Rearrangement Data • Genome data is represented as a circular ordering of genes • “Gene orders” • Each gene represents a known nucleotide sequence • Each gene has a positive or negative orientation • Rare evolutionary events cause gene rearrangements • Inversion g0 g1g2 g3 g4 g5g0 g1–g4 –g3 –g2 g5 • Transposition g0 g1g2 g3 g4 g5 g0g2 g3 g4 g1 g5 • Inverted Transposition g0 g1g2 g3 g4 g5 g0–g4 –g3 –g2g1 g5
Breakpoint Distance Metric • Estimation of number of rearrangement events between gene orders A and B • # of adjacencies: g h in A that doesn’t correspond to g h or –h –g in B • Example: • A = 1 2 3 4 5 • B = -2 -1 -5 -4 3 • Breakpoint distance = 2
M A B C Median • Ancestral vertices are computed using a median computation • All internal vertices have degree 3 • Find M that optimally minimizes median score score = d(A,M) + d(B,M) + d(C,M) • Breakpoint median: • d() is breakpoint distance d(A,M) d(B,M) d(C,M)
Breakpoint Median Algorithm as a TSP • Construct a fully connected graph containing all gand –g for each gene • w(g,-g) = -¥ • Initialize all other weights to be 3 • For each adjacency gh in the three genomes, decrement weight between vertex –g and h • Solve TSP, median is the even-indices of the tour (score = tour cost) - - + + 1 2 1 2 A = -1 +2 -4 -3 B = -1 -2 +3 +4 C = -2 +3 +4 +1 cost = -¥ cost = 0 cost = 1 cost = 2 - + - + + - + - 4 3 4 3 - + - + An optimal solution corresponding to genome +1 +2 -3 -4 Edges not shown have cost = 3
Breakpoint Median Implementation • Optimal TSP is feasible due to small graph • Implemented as a depth-first branch-and-bound search • Upper bound is the current best tour • Lower-bound is computed using a linear greedy algorithm • Select a set of minimal-weight edges to complete a partially-constructed tour • To tighten: edges not considered that… • have been pruned at or above the current level of the search tree • that would create a cycle not including all cities
Breakpoint Median Algorithm Edge list: Search state: edges (-3,4,w=0) (2,3,w=1) (1,2,w=2) (-1,-2,w=2) (1,-2,w=2) (-2,-4,w=2) (-1,3,w=2) (-1,-4,w=2) (1,-4,w=2) solution 1 -1 2 -2 3 -3 4 -4 otherEnd 1 => -1 -1 => 1 2 => -2 -2 => 2 3 => -3 -3 => 3 4 => -4 -4 => 4 used cost=0 excluded
Breakpoint Median Algorithm Edge list: Search state: edges (-3,4,w=0) (2,3,w=1) (1,2,w=2) (-1,-2,w=2) (1,-2,w=2) (-2,-4,w=2) (-1,3,w=2) (-1,-4,w=2) (1,-4,w=2) solution 1 -1 2 -2 3 -3 4 -4 otherEnd 1 => -1 -1 => 1 2 => -2 -2 => 2 3 => -4 -3 => 3 4 => -4 -4 => 3 used -3, 4 cost=0 excluded solution 1 -1 2 -2 3 -3 4 -4 stack stack cost=0
Breakpoint Median Algorithm Edge list: Search state: edges (-3,4,w=0) (2,3,w=1) (1,2,w=2) (-1,-2,w=2) (1,-2,w=2) (-2,-4,w=2) (-1,3,w=2) (-1,-4,w=2) (1,-4,w=2) solution 1 -1 2 -2 3 -3 4 -4 otherEnd 1 => -1 -1 => 1 2 => -2 -2 => -4 3 => -4 -3 => 3 4 => -4 -4 => -2 used -3, 4, 2, 3 cost=0 excluded solution 1 -1 2 -2 3 -3 4 -4 solution 1 -1 2 -2 3 -3 4 -4 cost=0 cost=1
Breakpoint Median Algorithm Edge list: Search state: edges (-3,4,w=0) (2,3,w=1) (1,2,w=2) (-1,-2,w=2) (1,-2,w=2) (-2,-4,w=2) (-1,3,w=2) (-1,-4,w=2) (1,-4,w=2) solution 1 -1 2 -2 3 -3 4 -4 otherEnd 1 => -1 -1 => 1 2 => -2 -2 => -4 3 => -4 -3 => 3 4 => -4 -4 => -2 used -3, 4, 2, 3 cost=0 excluded solution 1 -1 2 -2 3 -3 4 -4 solution 1 -1 2 -2 3 -3 4 -4 cost=0 cost=1
stack Breakpoint Median Algorithm Edge list: Search state: edges (-3,4,w=0) (2,3,w=1) (1,2,w=2) (-1,-2,w=2) (1,-2,w=2) (-2,-4,w=2) (-1,3,w=2) (-1,-4,w=2) (1,-4,w=2) solution 1 -1 2 -2 3 -3 4 -4 otherEnd 1 => -1 -1 => 1 2 => -2 -2 => 2 3 => -4 -3 => 3 4 => -4 -4 => 3 used -3, 4 cost=0 excluded (2,3) solution 1 -1 2 -2 3 -3 4 -4 cost=0
Breakpoint Median Algorithm Edge list: Search state: edges (-3,4,w=0) (2,3,w=1) (1,2,w=2) (-1,-2,w=2) (1,-2,w=2) (-2,-4,w=2) (-1,3,w=2) (-1,-4,w=2) (1,-4,w=2) solution 1 -1 2 -2 3 -3 4 -4 otherEnd 1 => -1 -1 => -2 2 => -2 -2 => -1 3 => -4 -3 => 3 4 => -4 -4 => 3 used -3, 4, 1, 2 cost=0 excluded (2,3) solution 1 -1 2 -2 3 -3 4 -4 solution 1 -1 2 -2 3 -3 4 -4 cost=0 cost=2
Breakpoint Median Algorithm Edge list: Search state: edges (-3,4,w=0) (2,3,w=1) (1,2,w=2) (-1,-2,w=2) (1,-2,w=2) (-2,-4,w=2) (-1,3,w=2) (-1,-4,w=2) (1,-4,w=2) solution 1 -1 2 -2 3 -3 4 -4 otherEnd 1 => -1 -1 => -2 2 => -2 -2 => -1 3 => -4 -3 => 3 4 => -4 -4 => 3 used -3, 4, 1, 2 cost=0 excluded (2,3) solution 1 -1 2 -2 3 -3 4 -4 solution 1 -1 2 -2 3 -3 4 -4 cost=0 cost=2
Breakpoint Median Algorithm Edge list: Search state: edges (-3,4,w=0) (2,3,w=1) (1,2,w=2) (-1,-2,w=2) (1,-2,w=2) (-2,-4,w=2) (-1,3,w=2) (-1,-4,w=2) (1,-4,w=2) solution 1 -1 2 -2 3 -3 4 -4 otherEnd 1 => -1 -1 => 3 2 => -2 -2 => -1 3 => -1 -3 => 3 4 => -4 -4 => 3 used -3, 4, 1, 2, -2, -4 cost=0 excluded (2,3) solution 1 -1 2 -2 3 -3 4 -4 solution 1 -1 2 -2 3 -3 4 -4 solution 1 -1 2 -2 3 -3 4 -4 cost=0 cost=2 cost=4
Breakpoint Median Algorithm Edge list: Search state: edges (-3,4,w=0) (2,3,w=1) (1,2,w=2) (-1,-2,w=2) (1,-2,w=2) (-2,-4,w=2) (-1,3,w=2) (-1,-4,w=2) (1,-4,w=2) solution 1 -1 2 -2 3 -3 4 -4 otherEnd 1 => -1 -1 => 3 2 => -2 -2 => -1 3 => -1 -3 => 3 4 => -4 -4 => 3 used -3, 4, 1, 2, -2, -4, -1, 3 cost=0 excluded (2,3) solution 1 -1 2 -2 3 -3 4 -4 solution 1 -1 2 -2 3 -3 4 -4 solution 1 -1 2 -2 3 -3 4 -4 cost=0 solution 1 -1 2 -2 3 -3 4 -4 cost=2 tour is -1, 1, 2, -2, -4, 4, -3, 3 median is -1, 2, -4, -3 cost=4 cost=6
Median Core Architecture top level controller • Computation is sequential • add edge 7 cycles • prune edge 2 or 10 cycles • compute lower bound 2n+2 cycles • 56 MHz 21/444 BRAMs/core 1% slices/core
Accelerator Architecture • Fill FPGAs with median cores • Fan-outs and fan-ins are pipelined to meet PCI-X timing • Platform: • Annapolis Wild-Star II Pro • Virtex-2 Pro 100 -5 • I/O • Programmed I/O • Hosts polls each core for state • Comm. overhead is significant for easy medians
Phylogeny Scoring Steps • Initialize unlabeled tree • Use 3 nearest labels • Initialize upper bound from inputs g4 g1 g3 g2 g5 g5 g6 • Iteratively refine tree to convergence • Use 3 immediate neighbors • Initialize upper bound using score of previous label g4 g1 g3 g2 g5 g5 g6
Extracting Parallelism: Initialization A B A B A, B, C d(A,B) 0 d(A,B) core 0 ub 0 A B d(A,C) d(B,C) core 1 ub - 1 C C A core 2 ub - 2 d(A,C) C … d(B,C) 0 B C core n-1 ub - n - 1 initial upper bound = ub = d(A,B) + d(A,C) d(B,A) + d(B,C) d(C,A) + d(C,B) Core with a lower initial upper bound will converge on solution fastest
Performance Results: Median Computation Average over 1000 median computations 12 cores => 25X speedup
Extracting Parallelism: Re-Labeling • All medians are dispatched in parallel for each iteration • Score of previous median used as initial upper bound g4, m1, m2 core 0 score(m0) m0, g1, g3 core 1 score(m1) m0 m0, g2, m3 core 2 score(m2) g4 m1 m2 m2, g5, g6 core 3 score(m3) g1 g3 g2 g5 m3 g5 g6
Performance Results: Accelerated GRAPPA • Replace software median with driver for FPGA card • Initialization phase: • Use 12 median cores • Re-labeling phase: • Parallel labeling • Use n - 2 median cores • Average over 10 GRAPPA runs
Conclusions • Breakpoint median computation: combinatorial optimization algorithm • Control-dependent, memory-intensive • Median core consistently achieves speedup over software and only requires 4% of FPGA resources • Initial results show that median-level parallelism can be achieved (take advantage of hardware) • Up to 25X application speedup
Future Work • More efficient technique to parallelize median computation • Inversion median core • Design tree generation and bounding cores • Bottleneck for larger input sets • Initial design requires only 2 BRAMs • Develop and package library of phylogenetic cores • Develop tool that generates architecture based on characteristics of the input set