Genetic Linkage Analysis
Genetic Linkage Analysis. Lectures 8 – Oct 24, 2011 CSE 527 Computational Biology, Fall 2011 Instructor: Su-In Lee TA: Christopher Miles Monday & Wednesday 12:00-1:20 Johnson Hall (JHN) 022. Outline. Review: disease association studies Association vs linkage analysis


Genetic Linkage Analysis
E N D
Presentation Transcript
Genetic Linkage Analysis Lectures 8 – Oct 24, 2011 CSE 527 Computational Biology, Fall 2011 Instructor: Su-In Lee TA: Christopher Miles Monday & Wednesday 12:00-1:20 Johnson Hall (JHN) 022
Outline • Review: disease association studies • Association vs linkage analysis • Genetic linkage analysis • Pedigree-based gene mapping • Elston-Stewart algorithm • Systems biology basics • Gene regulatory network
genetic markers on 0.1-1M SNPs G G G T T G G G G T A A A C A C C C C C P-value = 0.2 P-value = 1.0e-7 Genome-Wide Association Studies …ACTCGGTAGGCATAAATTCGGCCCGGTCAGATTCCATACAGTTTGTACCATGG… …ACTCGGTGGGCATAAATTCGGCCCGGTCAGATTCCATACAGTTTGTTCCATGG… …ACTCGGTAGGCATAAATTCGGCCCGGTCAGATTCCATACAGTTTGTACCATGG… : : …ACTCGGTGGGCATAAATTCTGCCCGGTCAGATTCCATCCAGTTTGTACCATGG… …ACTCGGTGGGCATAAATTCTGCCCGGTCAGATTCCATACAGTTTGTTCCATGG… Case …ACTCGGTGGGCATAAATTCGGCCCGGTCAGATTCCATCCAGTTTGTTCCATGG… …ACTCGGTGGGCATAAATTCGGCCCGGTCAGATTCCATCCAGTTTGTACCATGG… …ACTCGGTGGGCATAAATTCGGCCCGGTCAGATTCCATCCAGTTTGTACCATGG… : : …ACTCGGTGGGCATAAATTCGGCCCGGTCAGATTCCATCCAGTTTGTACCATGG… …ACTCGGTGGGCATAAATTCTGCCCGGTCAGATTCCATCCAGTTTGTTCCATGG… • Any disadvantages? • Hypothesis-free: we search the entire genome for associations rather than focusing on small candidate areas. • The need for extremely dense searches. • The massive number of statistical tests performed presents a potential for false-positive results (multiple hypothesis testing) Control
Association vs Linkage Analysis • Any disadvantages? • Hypothesis-free: we search the entire genome for associations rather than focusing on small candidate areas. • The need for extremely dense searches. • The massive number of statistical tests performed presents a potential for false-positive results (multiple hypothesis testing) • Alternative strategy – Linkage analysis • It acts as systematic studies of variation, without needing to genotype at each region. • Focus on a family or families.
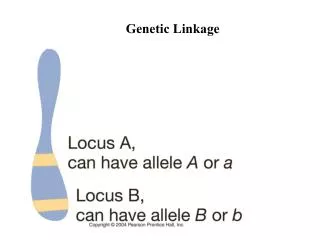
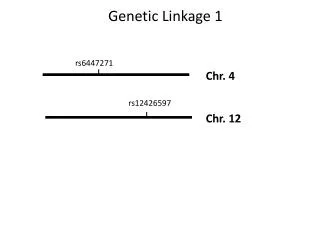
Basic Ideas Neighboring genes on the chromosome have a tendency to stick together when passed on to offspring. Therefore, if some disease is often passed to offspring along with specific marker-genes, we can conclude that the gene(s) responsible for the disease are located close on the chromosome to these markers.
Outline • Review: disease association studies • Association vs linkage analysis • Genetic linkage analysis • Pedigree-based gene mapping • Elston-Stewart algorithm • Systems biology basics • Gene expression data • Gene regulatory network
Genetic linkage analysis • Data • Pedigree: set of individuals of known relationship • Observed marker genotypes • Phenotype data for individuals • Genetic linkage analysis • Goal – Relate sharing of specific chromosomal regions to phenotypic similarity • Parametric methods define explicit relationship between phenotypic and genetic similarity • Non-parametric methods test for increased sharing among affected individuals
Reading a Pedigree Circles are female, squares are males Shaded symbols are affected, half-shaded are carriers Genotypes of certain gene(s) are given for some individuals What is the probability to observe a pedigree above?
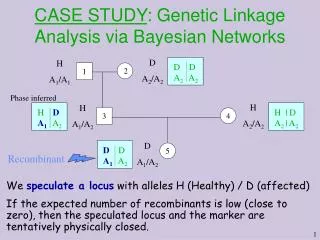
Elements of Pedigree Likelihood • Prior probabilities • For founder genotypes • Transmission probabilities • For offspring genotypes, given parents • Penetrances • For individual phenotypes, given genotype
Probabilistic model for a pedigree: (1) Founder (prior) probabilities 1 Dd P(father Dd) = 2 x .01 x .99 2 1 dd Dd • Founders are individuals whose parents are not in the pedigree • They may or may not be typed. Either way, we need to assign probabilities to their actual or possible genotypes. • This is usually done by assuming Hardy-Weinberg equilibrium (HWE). If the frequency of D is .01, HW says • Genotypes of founder couples are (usually) treated as independent. P(father Dd, mother dd) = (2 x .01 x .99) x (.99)2
Probabilistic model for a pedigree: (2) Transmission probabilities I 2 1 Dd Dd 3 dd P(children 3 dd | father Dd, mother dd) = ½ x ½ • According to Mendel’s laws, children get their genes from their parents’ genes independently: • The inheritances are independent for different children.
Probabilistic model for a pedigree: (2) Transmission probabilities II 2 1 Dd Dd 3 4 5 dd Dd DD P(3 dd, 4 Dd, 5DD | 1 Dd, 2 dd) = (½ x ½) x (2 x ½ x ½) x (½ x ½) The factor 2 comes from summing over the two mutually exclusive and equiprobable ways 4 get a D and a d.
Probabilistic model for a pedigree: (3) Penetrance probabilities I DD P(affected | DD) = 1 DD P(affected | DD) = .8 • Independent penetrance model • Pedigree analyses usually suppose that, given the genotype at all loci, and in some cases age and sex, the chance of having a particular phenotype depends only on genotype at one locus, and is independent of all other factors: genotypes at other loci, environment, genotypes and phenotypes of relative, etc • Complete penetrance • Incomplete penetrance
Probabilistic model for a pedigree: (3) Penetrance probabilities II DD (45) P(affected | DD, male, 45 y.o.) = .6 Age & sex-dependent penetrance
Probabilistic model for a pedigree: Putting all together I 2 1 Dd Dd 3 4 5 dd Dd DD • Assumptions • Penetrance probabilities: P(affected | dd)=0.1, p(affected | Dd)=0.3, P(affected | DD)=0.8 • Allele frequency of D is .01 • The probability of this pedigree is the product: • (2 x .01 x .99 x .7) x (2 x .01 x .99 x .3) x (½ x ½ x .9) x (2 x ½ x ½ x .7) x (½ x ½ x .8)
Elements of pedigree likelihood A pedigree Bayesian network representation g1 g2 2 1 x1 g4 x2 g3 4 3 x4 x3 g5 x5 5 • Prior probabilities • For founder genotypes e.g. P(g1), P(g2) • Transmission probabilities • For offspring genotypes, given parents e.g. P(g4|g1,g2) • Penetrance • For individual phenotypes, given genotype e.g. P(x1|g1)
Elements of pedigree likelihood A pedigree Bayesian network representation g1 g2 2 1 x1 g4 x2 g3 4 3 x4 x3 g5 x5 5 Probability of founder genotypes Probability of offspring given parents Probability of phenotypes given genotypes • Overall pedigree likelihood
Probabilistic model for a pedigree: Putting all together II All possible genotypes of individual 1 If the individual i’s genotype is known to be gi, then Gi = {gi} • To write the likelihood of a pedigree given complete data: • We begin by multiplying founder gene frequencies, followed by transmission probabilities of non-founders given their parents, next penetrance probabilities of all the individuals given their genotypes. • What if there are missing or incomplete data? • We must sum over all mutually exclusive possibilities compatible with the observed data.
Probabilistic model for a pedigree: Putting all together II 2 1 Dd ?? 3 4 5 dd Dd DD • What if there are missing or incomplete data? • We must sum over all mutually exclusive possibilities compatible with the observed data.
Computationally … 2 1 ?? ?? 3 4 5 ?? ?? ?? • To write the likelihood of a pedigree: • Computation rises exponentially with # people n. • Computation rises exponentially with # markers • Challenge is summation over all possible genotypes (or haplotypes) for each individual.
Computationally … • Two algorithms: • The general strategy of beginning with founders, then non-founders, and multiplying and summing as appropriate, has been codified in what is known as the Elston-Stewart algorithm for calculating probabilities over pedigrees. • It is one of the two widely used approaches. The other is termed the Lander-Green algorithm and takes a quite different approach.
Elston and Stewart’s insight… • Focus on “special pedigree” where • Every person is either • Related to someone in the previous generation • Marrying into the pedigree • No consanguineous marriages • Process nuclear families, by fixing the genotype for one parent • Conditional on parental genotypes, offsprings are independent … Gf Gm Go1 Gon
Elston and Stewart’s insight… • Conditional on parental genotypes, offsprings are independent • Thus, avoid nested sums, and produce likelihood whose cost increases linearly with the number of offspring … Gf Gm Go1 Gon
Successive Conditional Probabilities Gspouse Gparent =Gk Go1 G Gon G G G • Starting at the bottom of the pedigree… • Calculate conditional probabilities by fixing genotypes for one parent • Specifically, calculate Hk (Gk) • Probability of descendants and spouse for person k • Conditional on a particular genotype Gk
Formulae … Probability of o’s spouse and descendants when it’s genotype is Go Gspouse Gparent • So for each parent, calculate • By convention, for individuals with no descendants Go1 G Gon G G G
Final likelihood P(X, given genotypes | Gfounder)=Hfounder (Gfounder) • After processing all nuclear family units • Simple sum gives the overall pedigree likelihood • How?
What next? • Computation of the pedigree likelihood • For every marker, we want to • Compute the pedigree likelihood for each marker and choose the marker that is closely linked to the disease gene.
Outline • Review: disease association studies • Association vs linkage analysis • Genetic linkage analysis • Pedigree-based gene mapping • Elston-Stewart algorithm • Systems biology basics • Review: gene regulation • Gene expression data • Gene regulatory network
DNA AGATATGTGGATTGTTAGGATTTATGCGCGTCAGTGACTACGCATGTTACGCACCTACGACTAGGTAATGATTGATC AGATATGTGGATTGTTAGGATTTATGCGCGTCAGTGACTACGCATGTTACGCACCTACGACTAGGTAATGATTGATC Gene AUGAUUAU AUGCGCGUC AUGAUUGAU AUGAUUGAU AUGUUACGCACCUAC RNA AUGUGGAUUGUU RNA degradation MID Protein MID MID MWIV MLRTY MRV gene Genetic regulatory network Review: Gene Regulation a switch! (“transcription factor binding site”) Gene regulation transcription AUGCGCGUC translation MRV “Gene Expression” Genes regulate each others’ expression and activity.
i j Eij - RNA level of gene j in experiment i Gene expression data Down-regulated Experiments (samples) Up-regulated Induced Co-expression genes? ⇒ functionally related? Genes Repressed
Goal: Inferring regulatory networks “Expression data” Experimental conditions Q≈2x10⁴ (for human) e6 e1 eQ … • Infer the regulatory network that controls gene expression • Causality relationships among e1-Q • Bayesian networks B A A and B regulate the expression of C (A and B are regulators of C) C
Data instances Clustering expression profiles
Merge closest pair Hierarchical agglomerative • Compute all pairwise distances Data instances
Data instances Infer gene function Clustering expression profiles Limitations: • No explanation on what caused expression of each gene • (No regulatory mechanism) Co-regulated genes cluster together
Goal: Inferring regulatory networks “Expression data” Experimental conditions Q≈2x10⁴ (for human) e6 e1 eQ … • Infer the regulatory network that controls gene expression • Causality relationships among e1-Q • Bayesian networks B A A and B regulate the expression of C (A and B are regulators of C) C
X1 X2 X4 X3 X5 X6 Regulatory network • Bayesian network representation • Xi: expression level of gene i • Val(Xi): continuous • Interpretation • Conditional independence • Causal relationships • Joint distribution • P(X) = Conditional probability distribution (CPD)?
X1 RNAlevel X2 Upstream regionof target gene (X5) X4 X3 Activator (X3) X5 X6 activatorbinding site Repressor (X4) Activator (X3) activatorbinding site repressorbinding site Context specificity of gene expression Context ABasal expression level ? Context BActivator induces expression Context CActivator + repressor decrease expression
X1 RNAlevel X2 Upstream regionof target gene (X5) X4 X3 Activator (X3) X5 X6 activatorbinding site Repressor (X4) P(Level) Activator (X3) P(Level) Level Level 3 -3 P(Level) . . . activatorbinding site repressorbinding site Level 0 Context specificity of gene expression Context ABasal expression level ? Context BActivator induces expression X3 false true X4 Context CActivator + repressor decrease expression false true Context A Context B Context C
X1 X3 false true X2 X4 X4 X3 false true P(Level) P(Level) Context A Level Level 3 Context B Context C -3 P(Level) . . . X5 X6 Level 0 Parameterization • Tree conditional probability distributions (CPDs) • mean (μ) & variance (σ2) of the normal distribution in each context Tree CPD (μA,σA) (μB,σB) (μC,σC)
X3 X1 false true X4 X2 P(Level) false true P(Level) X4 X3 Level Level 3 (μA,σA) -3 P(Level) . . . Context A (μC,σC) Context C Context B (μB,σB) X5 X6 Level 0 Reconstructing the network • Training data • Gene expression data • Goal • Learn the structure & tree CPDs parameters
X1 X2 X4 X3 X5 X6 Learning • Structure learning [Koller & Friedman] • Constraint based approaches • Score based approaches • Bayesian model averaging • Scoring function • Likelihood score • Bayesian score Given a set of all possible network structures and the scoring function that measures how well the model fits the observed data, we try to select the highest scoring network structure.