Data Analytics Courses
ExcelR is a leading Data analytics course in pune training institute. Data analytics course in pune will be delivered by highly experienced and certified trainers who are considered as one the best trainers in the industry and so we are considered to be one of the best Data analytics course in pune training institutes.<br>

Data Analytics Courses
E N D
Presentation Transcript
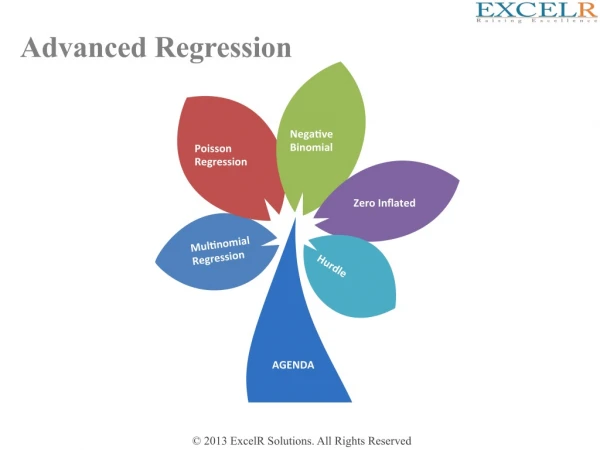
Introduction to Poisson Regression It assumes that the data or output variable follows Poisson distribution Poisson distribution takes values from 0 to infinity We go for Poisson Regression when Variance = Mean = ƛ Output variable - Y is Count/Defect (Discrete) Input variable - X can take any value
Examples of Poisson Regression Example 1. The number of persons killed by mule or horse kicks in the Prussian army per year. Ladislaus Bortkiewicz collected data from 20 volumes of Preussischen Statistik. These data were collected on 10 corps of the Prussian army in the late 1800s over the course of 20 years. Example 2. The number of people in line in front of you at the grocery store. Predictors may include the number of items currently offered at a special discounted price and whether a special event (e.g., a holiday, a big sporting event) is three or fewer days away. Example 3. The number of awards earned by students at one high school. Predictors of the number of awards earned include the type of program in which the student was enrolled (e.g., vocational, general or academic) and the score on their final exam in math.
Description of the data In this example, num_awards is the outcome variable and indicates the number of awards earned by students at a high school in a year, math is a continuous predictor variable and represents students’ scores on their math final exam, and prog is a categorical predictor variable with three levels indicating the type of program in which the students were enrolled. It is coded as 1 = “General”, 2 = “Academic” and 3 = “Vocational”.
CONTACT US www.excelr.com surya@excelr.com +91 9880913504 ExcelR - Data Science, Data Analytics Course Training in Pune Address: 102, 1st Floor, Phase II, Prachi Residency Opposite to Kapil Malhar, Baner Rd, Baner, Pune,Maharashtra 411046 Hour: Mon- Sat 07AM – 11PM Established in Year: 2013 THANK YOU