Download
1 / 23
230 likes | 530 Vues
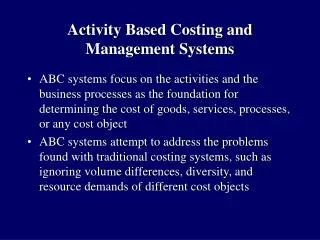
Activity Based Costing and Management Systems. ABC systems focus on the activities and the business processes as the foundation for determining the cost of goods, services, processes, or any cost object

E N D
Activity Based Costing and Management Systems • ABC systems focus on the activities and the business processes as the foundation for determining the cost of goods, services, processes, or any cost object • ABC systems attempt to address the problems found with traditional costing systems, such as ignoring volume differences, diversity, and resource demands of different cost objects
ABC Basics • ABC systems use a cost hierarchy: unit level, batch level, product sustaining level, and facility sustaining level • ABC systems, as part of identifying the relevant activities, also classify these activities into value-added and non-value added activities, so it becomes a management tool • ABC systems recognize not only economies of scale but economies of scope • At the heart of ABC is a two stage allocation process
The Two Stage Process in ABC • Stage 1: Create homogeneous cost pools based on activities and/or processes; e.g., group all purchasing costs together, all set-up costs together, all delivery costs together. This may take some work since most accounting systems gather cost by account categories such as salaries, depreciation, supplies, etc. and these accounts have to be studied in order to break them down into homogeneous costs pools • Stage 2: Allocate from the cost pools to the cost object (usually a product) using second stage cost drivers; e.g., number of deliveries, number of setups
Mapping Resource Expenses to Activities: Stage One Salaries and Fringes $313,000 Occupancy $111,000 Equipment and Technology $146,000 Materials and Supplies $30,000 Total $600,000
An ABC Example Supermarkets Drugstores MA and Pa Total Average Revenue per delivery $30,900 $10,500 $1,980 Average CGS per delivery 30,000 10,000 1,800 Gross Margin per delivery 900 500 180 Number of Deliveries 120 300 1,000 1,420 Total Gross margin $108,000 $150,000 $180,000 $438,000 Gross Margin % 2.9% 4.8% 9.1% Other operating Costs 301,080 Operating Profit 136,920 Allocation of Other Costs 74,239 103,110 123,731 301,080 Distribution Line Profit 33,761 46,890 56,269 136,920 Profit Margin 0.9% 1.5% 2.8% Other Costs are allocated in proportion to Gross Margin 301,080/438,000 = 68.7%; Ma and Pa = 68.7% * 180,000 = 123,731
An ABC Example, 2 The manager of this pharmaceutical distribution company heard about ABC and thought it may be useful for his operations. He identified 5 key activities, and their corresponding cost drivers. Activity Cost Driver Order Processing Number of Orders Line Item Ordering Number of Line Items Store Delivery Number of Store Deliveries Cartons Shipped to Stores Number of Cartons shipped/delivery Shelf Stacking at Store Number of hours of shelf stacking
An ABC Example, 3 Each order consists of one or more line items. A line item represents a single product (such as Extra Strength Tylenol. Each Store delivery entails delivery of one or more cartons of products. Each product is delivered in one or more separate cartons. The delivery staff stock cartons directly onto display shelves in a store. Currently there is no charge for this service, and not all customers use this service.
An ABC Example, 4 The firm has finished Stage 1 and has assigned the following costs to each of the five activity areas Activity Area Total Costs Total Units of Cost Driver Order Processing $80,000 2,000 orders Line Item Ordering 63,840 21,280 line items Store Deliveries 71,000 1,420 store deliveries Carton Deliveries 76,000 76,000 cartons Shelf Stacking 10,240 640 hours
An ABC Example, 5 Other useful data by distribution line Supermarkets Drugstores Ma and Pa 1. Total number of orders 140 360 1,500 2. Average number of line items per order 14 12 10 3. Total number of store deliveries 120 300 1,000 4. Average number of cartons shipped per delivery 300 80 16 5. Average number of hours of shelf stacking per delivery 3 0.6 0.1
An ABC Example, 6 First, calculate the cost driver rate for each cost pool. Activity Area Total Costs Total Units of Cost Driver Cost Driver Rate Order Processing $80,000 2,000 orders $40/order Line Item Ordering 63,840 21,280 line items 3/line item Store Deliveries 71,000 1,420 store deliveries 50/store delivery Carton Deliveries 76,000 76,000 cartons 1/carton Shelf Stacking 10,240 640 hours 16/hour
An ABC Example, 7 Next, allocate these costs to each distribution channel Supermarkets Drugstores Ma and Pa 1. Orders 140*40=5,600 360*40=14,400 1,500*40=60,000 2. Average line items 14 12 10 2a. Total line items 1,960*3=5,880 4,320*3=12,960 15,000*3=45,000 3. Deliveries 120*50=6,000 300*50=15,000 1,000*50=50,000 4. Average # of cartons 300 80 16 4a. Total cartons 36,000*1=36,000 24,000*1=24,000 16,000*1=16,000 5. Average stacking hours 3 0.6 0.1 5a. Total Stacking hours 360*16=5,760 180*16=2,880 100*16=1,600 Totals (= 301,080) 59,240 69,240 172,600
An ABC Example, 8 Comparing ABC to Traditional Costing Profit: Supermarket Traditional ABC Average Revenue per delivery $30,900 $30,900 Average CGS per delivery 30,000 30,000 Gross Margin per delivery 900 900 Number of Deliveries 120 120 Total Gross margin $108,000 $108,000 Allocation of Other Costs 74,239 59,240 Distribution Line Profit 33,761 48,760 Profit Margin 0.9% 1.3%
An ABC Example, 9 Comparing ABC to Traditional Costing Profit: Drugstores Traditional ABC Average Revenue per delivery $10,500 $10,500 Average CGS per delivery 10,000 10,000 Gross Margin per delivery 500 500 Number of Deliveries 300 300 Total Gross margin $150,000 $150,000 Allocation of Other Costs 103,110 69,240 Distribution Line Profit 46,890 80,760 Profit Margin 1.5% 2.6%
An ABC Example, 10 Comparing ABC to Traditional Costing Profit: Ma and Pa Traditional ABC Average Revenue per delivery $1,980 $1,980 Average CGS per delivery 1,800 1,800 Gross Margin per delivery 180 180 Number of Deliveries 1,000 1,000 Total Gross margin $180,000 $180,000 Allocation of Other Costs 123,731 172,600 Distribution Line Profit 56,269 7,400 Profit Margin 2.8% 0.4%
An ABC Example, 10 Summary Profit Comparison of Traditional vs. ABC Traditional ABC Supermarket 33,761 (0.9%) 48,760 (1.3%) Drugstores 46,890 (1.5%) 80,760 (2.6%) Ma and Pa 56,269 (2.8%) 7,400 (0.4%) Total 136,920 136,920
An ABC Example, 11 • Note that the total profit for the firm has not changed at all as a result of using ABC vs. traditional costing techniques • So what’s the big deal?? • Some people argue that for many firms using ABC is analogous to re-arranging the chairs on the deck of the Titanic - it really doesn’t stop a firm from failing • also, ABC is not GAAP • also, implementing ABC is a significant task • This is true if figuring out new product costs is the only thing ABC is used for
So What is the Value of ABC • Like any accounting system, ABC is an INFORMATION system - it provides info to assist decision makers, but in and of itself this info DOES NOTHING, unless management acts upon it • ABC provides insights into your business that management was probably not aware of before • The old system simply charged each line 68.7% of its gross margin to arrive at product line profitability - peanut butter costing
So What is the Value of ABC, 2 • The ABC system reveals however that the MA and PA stores actually consume 95.9% of its gross margin with other operating expenses • This is because the MA and PA stores are more activity intense, and thus more cost intensive • Under the old system, MA and PA stores were charged 41.1% (180,000/438,000) of overhead, since this was their share of gross margin • However, if you look at the activities, you can see that MA and PA stores account for well over 41.1% of the activities (75% of the orders, 70% of the deliveries, etc)
How can managers act on this info • Now that managers know the cost of these activities, they can work to try and reduce those costs • Also, they can see why Ma and Pa stores are so expensive (they order more often, they have more deliveries, etc.) and they work with these stores to try and reduce those activities; i.e., less frequent ordering, less frequent deliveries • Also, since part of ABC is activity identification and classification as VA or NVA, managers can attempt to eliminate or minimize NVA
When Would ABC not be Useful(at least from a product costing view) • If the company only has one product • If all products use all resources in the same proportions, which is the same proportion used to allocate costs in a traditional system (little diversity) • Cost control is not critical at this stage for the company (growth stage companies)
When Would ABC be most Useful • The Willie Sutton rule • large expenses in indirect and support resources • High diversity (products, customers, processes) • When a firm wants to better understand its activities and the costs of those activities, even if the firm only makes one product
Developing an ABC System, 1 • There are four sequential steps a firm would go through o develop an ABC system • Develop the activity dictionary • determine how much the organization is spending on each of its activities • identify the organization’s products, services, and customers • select activity cost drivers that link activity costs to the organization’s products, services, and customers • transaction, duration, and intensity
Developing an ABC System, 2 • The goal of an ABC system should not be to develop the most accurate, but one that balances the cost of errors made from inaccurate estimates with the cost of measurement • Activity cost drivers are the central innovation of ABC systems, but they are also the most costly