Download
1 / 64
650 likes | 824 Vues
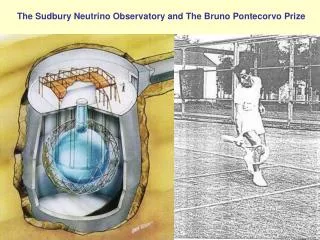
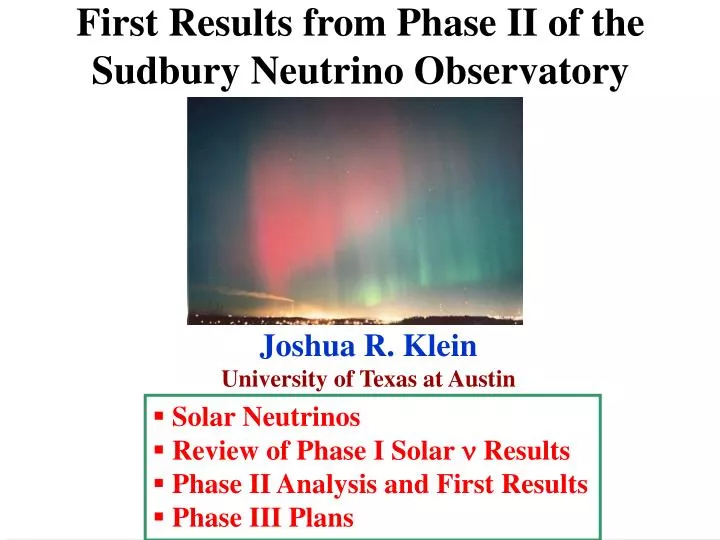
First Results from Phase II of the Sudbury Neutrino Observatory. Joshua R. Klein University of Texas at Austin. Solar Neutrinos Review of Phase I Solar n Results Phase II Analysis and First Results Phase III Plans. The Beam. Starts out as pure n e ….

E N D
First Results from Phase II of the Sudbury Neutrino Observatory Joshua R. Klein University of Texas at Austin • Solar Neutrinos • Review of Phase I Solar n Results • Phase II Analysis and First Results • Phase III Plans
The Beam Starts out as pure ne… Spectra determined by nuclear physics, not solar model
Solar Neutrino Experiments First experiment by Davis et al in 1960’s Radiochemical Method (Chlorine): Found ~ 1/3 of expected rate
After Six Solar n Experiments • 3 Gallium (Radiochemical) • 1 Chlorine (Radiochemical) • Kamiokande + Super-Kamiokande (Water Cerenkov)
Introduction to n Oscillations “Most natural explanation for measurements” Neutrinos are produced weak interaction (flavor) eigenstates (ne,nm,nt,…) but propagate in mass eigenstates (n1,n2,n3,…) The ne survival probability for two flavor mixing is:
Introduction to n Oscillations Neutrinos are produced weak interaction (flavor) eigenstates (ne,nm,…) but propagate in mass eigenstates (n1,n2,…) For three neutrino flavors, mixing is described by 3x3 matrix, analogous to quark sector cij = cosqij, sij = sinqij, CP phase d
Matter (MSW) Effects s(nm,t) = 0.154s(ne) Signatures: spectral distortion, time variation, depending on mixing angle:
Sudbury Neutrino Observatory Main goal: Direct observation of solar neutrino flavor change via inclusive appearance
The Sudbury Neutrino Observatory A collaboration of Chemists, Nuclear Physicists, and Particle Physicists United States Brookhaven Lab Los Alamos Lab LBL U. of Pennsylvania U. of Washington U. of Texas@Austin U.K. U. of Oxford Canada Carleton U. U. British Columbia U. of Guelph Laurentian U. Queens U.
Sudbury Neutrino Observatory 1000 tonnes D2O Support Structure for 9500 PMTs, 60% coverage 12 m Diameter Acrylic Vessel 1700 tonnes Inner Shielding H2O 5300 tonnes Outer Shield H2O Urylon Liner and Radon Seal
Calibration System and Sources Manipulator system allows flexible source placement Wide variety of sources for systematic studies • Diffusing laser source (optics/timing) • 16N 6.13 MeV ’s • p,T 19.8 MeV ’s • Neutrons 6.25 MeV ’s • 8Li ’s, E<14 MeV • Encapsulated U and Th sources
n Reactions in SNO n + Þ + + - CC d p p e e n + Þ + + n NC d p n x x ES - - + Þ + ν e ν e x x • Good measurement of ne energy spectrum • Weak directional sensitivity1-1/3cos(q) • Measure total 8B n flux from the sun. • Equal cross section for all n types • Mainly sensitive to ne,, some sensitivity to n and n • Strong directional sensitivity
Two possibilities: Advantages: Inclusive nmt Appearance • NC gives total flux directly • Cross section uncertainties cancel Advantages: • ES excess points to Sun • Can match energy regimes • Super-K precision measurement
Radioactive Backgrounds Cosmic rays < 3/hour
Signal/Background Spectra Prospects for measurement in pure D2O phase not optimistic Addition of NaCl increases capture probability and energy of emitted g-ray Counts Reconstructed inside D2O per year Numberof Hit PMTs ~Energy • Monte Carlo predictions for pure solar ne
ExtractingSignals Energy Distribution Radial Distribution (R3, RAV=1) Solar Direction Distribution Can use derived observables (R3, cosqsun, and E) to produce pdfs. Max. Likelihood fit for relative signal amplitudes
Extraction Prerequisites Data Processing Remove backgrounds Reconstruct position and energy Background Measurement Determine remaining contamination Model Building For producing distributions Calculating acceptances Signal Extraction Final fits to data Calculation of fluxes
Phase I (Pure D2O) Results SNO measurements: (units 106 cm-2 s-1) • Flux Measurements (Standard 8B shape assumed) Can resolve these directly into neutrino flavors
Phase I (Pure D2O) Results • The non-ne solar flux A change of variables gives: (units 106 cm-2 s-1) `Null hypothesis’ of fmt=0 rejected at ~ 5 s level.
Phase I (Pure D2O) Results • SNO Compared to Other Solar Expts.
ANC =0: ACC= AE= Looking for the Matter Effect ANC Unconstrained:
Phase I (Pure D2O) Results • Constraints on Mixing Parameters
The Story So Far • SNO Phase I results reject null hypothesis • Independent of solar flux model • Large Mixing Angle region strongly favored… • …but precision limited by SNO CC/NC anticorrelations… • …and total 8B flux n measurement oscillation-dependent. • Striking confirmation from KamLAND • Only Large Mixing Angle region left (assuming CPT…) • Maximal mixing still good possibility • Specific signatures of matter (MSW) effect as yet unobserved (mixing parameters are `unlucky’).
SNO Phase II (Salt Phase) g n 36Cl* 36Cl 35Cl • Advantages of NaCl: Capture Efficiency 35Cl has ~4x higher n capture rate than d Total E emitted ~ 2 MeV higher 2 tons of NaCl added June 1, 2001
SNO Salt Phase Legendre Terms (b14) • Advantages of NaCl: Event Isotropy g multiplicity means PMT hit pattern for neutron events more isotropic than for single Cerenkov electrons How to characterize? Two-pt Correlation Fcn Tests Mean Pair Angle (qij) Better separation+ Ease of systematic characterization simplest Best separation
SNO Salt Phase • Did this work? Salt Isotropy Distsribution Compared to D2O phase Salt E spectrum compared to D2O Phase
SNO Phase II (Salt Phase) • Blind Analysis Goal is to ensure independence from pure D2O phase • Two Approaches: • NC: Accept small (unknown) number • of muon follower neutrons, use • `spoiled’ NC cross section in flux • calcs • B. CC/ES: pre-scale data set by 80+/-10%
SNO Phase II (Salt Phase) CC ES NC Energy Distribution NC Shifted Radial Distribution (R3, RAV=1) NC Changed Solar Direction Distribution Unchanged Isotropy Distribution All New • Advantages of NaCl: Signal Extraction Covariances between Isotropy and Energy actually require 2D PDFs
Extraction Prerequisites Data Processing Remove backgrounds Reconstruct position and energy Background Measurement Determine remaining contamination Model Building For producing distributions Calculating acceptances Signal Extraction Final fits to data Calculation of fluxes
Data Processing • Data Set • Data from August, 2001 --- October, 2003 • Trigger threshold at 16 PMTs (roughly 2 MeV) • Run selection criteria: • Number of channels online • No calibration sources (or calibration activation*) • Run terminated normally • Trigger rates lower than x3 above nominal =20 Hz • Total of 254 live-days over this period
Data Processing Types: • Flasher PMTs • Static discharge • Electrical noise • Isotropic Acrylic Vessel events Low Level Criteria: • Charge and mean charge • Raw time distributions • Event time correlations • Veto PMT tags • Instrumental Background Removal
Data Processing • Summary of All Cuts • Instrumental Cuts • Spallation and `Follower Neutron’ Cuts (< 20 s after muon) • Atmospheric n neutron cuts (<250 ms after all N>100 events) • `Cerenkov Box’ Cuts on narrow timing and Cerenkov angle • Fiducial volume (Rfit < 550 cm) • Energy Threshold (Teff > 5.5 MeV) 435,721,068 triggers 3055 n candidates
Salt Phase: Model Building Need to know how detector measures: • Energy • Position and direction • neutron capture • Particle ID (e vs. n) Input to model: • Physics • measured optics and PMT resp. • measured electronics response • detector state Test with radioactive sources: • 16N 6.13 MeV ’s • Neutrons 6.25 MeV ’s • 8Li ’s, E<14 MeV • Low energy radioactive sources
Salt Phase: Model Building • Changing Energy Response Energy scale drift Energy Response vs. Date. • Looked at: • HV drift • Gain drift • Threshold drift • Attenuation changes • Concentratordegradation
Comparison of Modeled E response to Data Salt Phase: Model Building Calibration Source Data vs. Monte Carlo Uncertainty on energy scale = 1.1%
Comparison of Modeled Isotropy to Data Salt Phase: Model Building Uncertainty on isotropy mean 0.86%
Salt Phase: Model Building • Measured neutron capture vs radial position Total detection efficiency 0.399 in salt phase.
Background Measurement • Sources of Background • Instrumental • After all cuts, some leakage possible • Cerenkov events (b-g’s) • Energies fluctuate above analysis threshold • Or (mis)reconstruct within fiducial volume • Or actually have high energies (eg comic ray spallation nuclei) • Neutrons Created by • Photodisintegration of deuterons by g’s • Cosmic ray muons • Atmospheric neutrinos • (a,n) processes • Natural fission • Antineutrinos
Background Measurement Legendre Coefficients (b14) Even with looser isotropy cut for salt phase, residual contamination lower than few events. Fraction of hits in prompt time window • Instrumental Background `Contamination’ Instrumental Background Eliminate residual instrumentals by requiring events to have Cerenkov characteristics: Narrow timing Cerenkov hit pattern Remaining isotropic `AV’ events Measured with D2O and MC methods
Background Measurement • Cerenkov Events Inside Signal Box Primarily U and Th chains+24Na in Salt Phase • Sources of U and Th chain decays: • Residual H2O/D2O contamination • PMT support and array • Radon from mine air • Acrylic vessel contaminants
Background Measurement • Low Energy Radioactivity Ex-situ (radioassays) • Ion exchange (224Ra, 226Ra) • Membrane Degassing (222Rn) • Typically > 400 tons assayed In-situ (using Cerenkov light) • Low energy data analysis • Separate 208Tl & 214Bi • Good measure of time variation Event isotropy These both yield concentrations of U and Th Still need fraction above energy threshold and inside volume
Background Measurement • Radioassays • Bottom of vessel • 2/3 way up • Top of vessel • MnOx • HTiO • MnOx • HTiO
Background Measurement • Tail of `Cerenkov events’ inside D2O New technique: Rn `Spikes’ + Monte Carlo for Th and Na
Background Measurement • Misreconstruction of Events Into Volume from Outside Fit radial profile outside volume and extrapolate inside Total `internal’ + `external’ Cerenkov bkd < 14.7 events.
Background Measurement • Spallation Products Cosmogenic 16N most problematic… …but fewer than 3 events left after cuts.
Background Measurement • Neutrons Many potential sources…and they look exactly like NC events. Salt includes more backgrounds (eg 24Na) but also some new handles
Background Measurement • `External’ Sources of Neutrons • Photodisintegration from acrylic vessel and H2O radioactivity • (a,n) processes in acrylic MC Radial pdfs for Signals and Backgrounds High Cl capture cross section allows direct fit for all neutron sources outside fiducial volume (R/RAV)3
Background Measurment • 24Na neutrons 24Na: n capture on 23Na leads to decay and neutrons… • Sources: • Recirculation • Neck of acrylic vessel • Calibration source activation Test by `activating’ Na in neck of vessel and elsewhere Z (cm) Z (cm) r = (x2 + y2)1/2 (cm) r = (x2 + y2)1/2 (cm)
Background Measurment • Summary of Backgrounds