REDUCING CHILD OBESITY
REDUCING CHILD OBESITY . IOM APOP Texas CORD. STEVEN H KELDER, PhD , MPH Beth Toby Grossman Distinguished Professor of Spirituality and Healing Co-Director, Michael & Susan Dell Center for Healthy Living. THANK YOU FOR INVITING ME!. Portrait of an Overweight Child.

REDUCING CHILD OBESITY
E N D
Presentation Transcript
REDUCING CHILD OBESITY IOM APOP Texas CORD STEVEN H KELDER, PhD , MPH Beth Toby Grossman Distinguished Professor of Spirituality and Healing Co-Director, Michael & Susan Dell Center for Healthy Living
75 percent of young Americans are ineligible to join the military. Obesity is the leading reason applicants fail to qualify for military service. Otherwise excellent recruits, some with generations of family military service, are turned away because they are obese.
NHANES Age 12-20 All 34% White 31% Black 41% Hispanic 42% Overweight is defined as 85-95 percentile Obese is defined between the 95% and 120% of 95 percentile Severely Obese is defined as greater than 120% of the 95th percentile
NHANES Age 12-20How many kids are we talking about? Overweight is defined as 85-95 percentile Obese is defined between the 95% and 120% of 95 percentile Severely Obese is defined as greater than 120% of the 95th percentile
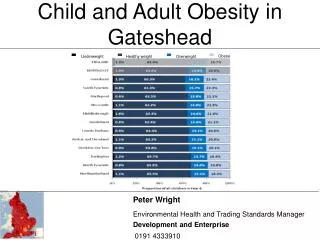
Percentage of High School Students Who Were Overweight,* 2011 State Youth Risk Behavior Surveys, 2011 10.7% - 13.8% 13.9% - 14.6% 14.7% - 15.7% 15.8% - 19.5% No Data * Students who were = 85th percentile but < 95th percentile for body mass index, based on sex- and age-specific reference data from the 2000 CDC growth charts.
Percentage of High School Students Who Were Obese,* 2011 State Youth Risk Behavior Surveys, 2011 7.3% - 10.8% 10.9% - 11.9% 12.0% - 14.6% 14.7% - 17.0% No Data * Students who were = 95th percentile for body mass index, based on sex- and age-specific reference data from the 2000 CDC growth charts.
PHYSICAL ACIVITY AND HEALTH Osteoporosis Prevention of Weight Gain Risk of “Disease” Diabetes Mellitus CHD Stroke Musculoskeletal Injury Functional Health Status Activity
Adopt policies and implement practices to reduce overconsumption of sugar-sweetened beverages. SSBs provide more calories and added sugars to American diets than any other food or beverage.
HBO’s The Weight of the Nation • Documentaries (4) for adult audience • Short documentaries (12) on specific topics in • obesity prevention • Documentaries (3) for children and families • Trade publication for general audiences • Website (http://theweightofthenation.hbo.com/) • Social media (Facebook, Twitter, Youtube, and GetGlue) • Screening kits with discussion guides • Marketing efforts, including reaching families with children • Written materials for school-age children and teachers (Scholastic, Inc.)
HOW MUCH NUTRITION EDUCATION IS ENOUGH? 7600 food ads/year 153 F&N/ year • Briggs, M., et. al, (2010). Position of the American Dietetic Association, School Nutrition Association, and Society for Nutrition Education: comprehensive school nutrition services. Journal of nutrition education and behavior, 42(6), 360-71. Society for Nutrition Education. • Kann, L., et. al, (2007). Health Education: Results from the School Health Policies and Programs Study 2006. The Journal of school health, 77(8), 408-34. doi:10.1111/j.1746-1561.2007.00228.
Whole-of-School After-school time Before School After-school Programs School Day Intramural Sports Physical Education Recess &Breaks Classroom Extramural Sports ~60 min/d ~6-7 hrs/d Active Commute From ~15 minutes Active Commute To ~15 minutes ~2-3hrs /d
Can school support 60 minutes or more of Physical Activity per day?
Te SCHOOL YEAR SCOPE AND SEQUENCE Delivery Type Teacher Led Video Led Peer Led TEA Foundation Curriculum: http://bit.ly/13fsUzj
Physical activity improves academic achievement, including grades and standardized test scores. • Physical activity impacts cognitive skills, including enhanced concentration, attention, and improved classroom behavior. • Increasing physical education time does not reduce academic performance.
CATCH 2.0Evidence | Cost-effective | Scalable | Nationwide | Recognized| Approved
GO, SLOW, WHOA Menu Signs • Cafeteria supervisors post daily menus with GO, SLOW, and WHOA foods identified.
Evidence • Randomized Control Trial • El Paso replication study • Travis County replication study • Child Obesity Research & Demonstration project
Pass & CATCH improves Stanford math & reading scores At Risk: adaptability, social skills, leadership, study skills, functional communication * * * Murray (UTSPH), under review
Cost Effectiveness • First year investment ~ $10.00 per child • Second year investment ~ $4.00 per child • “Childhood school-based programs such as CATCH are beneficial investments” “Based on the published literature, the most cost-effective way to prevent obesity in youth is CATCH…” – Harvard Economist, Cawley et al, 2010. Sources: Brown et al., 2007; Cawley et al, 2010