Spatiotemporal Analysis of Summer Precipitation Variability Over the Southern Great Plains
10 likes | 127 Vues
Explore the pentad analysis of summer precipitation patterns in the Southern Great Plains. Understand atmospheric-land surface interactions and their impact on hydroclimate variables. Discover insights to improve model predictions.

Spatiotemporal Analysis of Summer Precipitation Variability Over the Southern Great Plains
E N D
Presentation Transcript
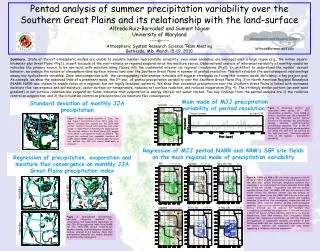
Pentad analysis of summer precipitation variability over the Southern Great Plains and its relationship with the land-surface Alfredo Ruiz–Barradas1 and Sumant NigamUniversity of Maryland----o----Atmospheric System Research Science Team MeetingBethesda, MD, March 15-19, 2010 1alfredo@atmos.umd.edu Summary. State-of-the-art atmospheric models are unable to simulate summer hydroclimate variability, even when anomalies are averaged over a large region (e.g., the million square-kilometer-plus Great Plains –Fig.1), in part, because of the over-reliance on regional evaporation as the moisture source. Observational analysis of interanual variability at monthly resolution indicates the primary source to be non-local, with moisture being fluxed into the continental interior via regional circulations (Fig2). In an effort to understand the models' deviant behavior, we analyze the nature of atmosphere–land-surface interactions over the Southern Great Plains in summer at pentad resolution. This will establish the spatiotemporal relationships among key hydroclimate variables. Close intercomparison with the corresponding relationships in models will suggest strategies on fixing this common model deficiency; a key project goal. As example, we show the observed links of a prominent mode, the 2nd one, of pentad precipitation variability over the Southern Great Plains (Fig. 3) in North American Regional Reanalysis (NARR: NARR was chosen to enable focus on a regional, but not highly localized, pattern). We show that excessive precipitation over the Southern Great Plains is linked with increased moisture flux convergence and soil moisture, cooler surface air temperature, reduced net surface radiation, and reduced evaporation (Fig. 4). The strikingly similar pattern (an east-west gradient) in net surface radiation and evaporation fields indicates that evaporation is energy limited; not water limited. Two key findings from the pentad analysis are 1) the radiative control on evaporation, and 2) the circulation control on precipitation (via moisture flux convergence). Main mode of MJJ precipitation variability at pentad resolution Standard deviation of monthly JJA precipitation Figure 3. Recurring pattern, and associated time series, of MJJ precipitation variability from NARR at pentad resolution over the expanded GP during the 1996-2002 period. Contour interval is 0.3 mm/day and green/brown shading denotes positive/negative precipitation anomalies. This is the 2nd Rotated EOF and the only whose maximum lies inside the SGP site (as outlined by the light blue box.) . This mode explains ~13% of the regional precipitation variability. Figure 1. Mean standard deviation of June, July and August precipitation from CPC’s daily US-Mexico retrospective analysis for the 1979-1998 period. Contour interval is 0.3 mm/day, and values larger or equal than 1.2 mm/day are shaded green. The red box defines the Great Plains (GP) domain from which a precipitation index is defined. The purple box defines the expanded Southern GP (SGP) where NARR data is analyzed, and the black box defines the SGP site where ARM data is analyzed. Regression of MJJ pentad NARR and ARM’s SGP site fields on the main regional mode of precipitation variability Regression of precipitation, evaporation and moisture flux convergence on monthly JJA Great Plains precipitation index Figure 4. NARR and ARM’s SGP site fields regressed on the PC of the 2nd REOF of MJJ precipitation at pentad resolution for the 1996-2002 period. Vertically integrated moisture flux convergence (up) and evaporation (down) anomalies from NARR are in the left column; evaporation (up) and net surface radiation (down) from the ARM’s SGP site data set are in the middle column; soil moisture content (up) and surface air temperature (down) from the ARM’s SGP site are in the right column. Green and brown represent positive and negative anomalies of moisture flux convergence, evaporation and soil moisture, while red/blue shading denotes positive/negative anomalies of net surface radiation and surface air temperature. Contour intervals are 0.3 mm/day for moisture flux convergence, 0.1 mm/day for evaporation, 0.3 for soil moisture, 2 W/m2 for the net surface radiation, and 0.1K for surface air temperature. Note that moisture flux convergence largely balances the anomalous precipitation, and that the structure and magnitude of evaporation anomalies are similar in both NARR and ARM’s SGP site. Note also that the structure of the net surface radiation and evaporation are very similar suggesting a radiative control on evaporation. Figure 2. Hydroclimate (precipitation, vertically integrated moisture flux convergence, and evaporation) regressions on the JJA GP precipitation index from NARR for the 1979-1998 period. Green/brown shading denotes positive/negative anomalies. Contour interval is 0.3 mm/day. Note that precipitation anomalies are largely balanced by moisture flux convergence.