Download
1 / 8
80 likes | 293 Vues
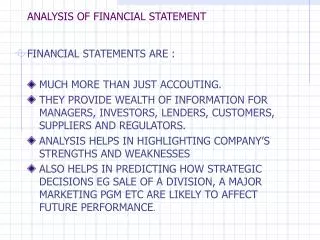
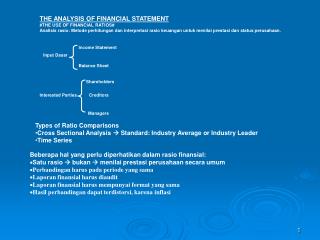
THE ANALYSIS OF FINANCIAL STATEMENT #THE USE OF FINANCIAL RATIOS# Analisis rasio: Metode perhitungan dan interpretasi rasio keuangan untuk menilai prestasi dan status perusahaan. Income Statement. Input Dasar Balance Sheet.

E N D
THE ANALYSIS OF FINANCIAL STATEMENT #THE USE OF FINANCIAL RATIOS# Analisis rasio: Metode perhitungan dan interpretasi rasio keuangan untuk menilai prestasi dan status perusahaan. Income Statement Input Dasar Balance Sheet Shareholders Interested Parties Creditors Managers • Types of Ratio Comparisons • Cross Sectional Analysis Standard: Industry Average or Industry Leader • Time Series • Beberapa hal yang perlu diperhatikan dalam rasio finansial: • Satu rasio bukan menilai prestasi perusahaan secara umum • Perbandingan harus pada periode yang sama • Laporan finansial harus diaudit • Laporan finansial harus mempunyai format yang sama • Hasil perbandingan dapat terdistorsi, karena inflasi
Liquidity Ratios • Activity Ratios • Financial Ratios Measure risk • Debt Ratios • Profitability Ratios Measure return • Measures of Liquidity: • Net Working Capital = Current Assets – Current Liabilities • Current Ratio = Current Assets : Current Liabilities • Quick (Acid Test) Ratio = (Current Assets) : (Current Liabilities-Inventory) • Measures of Activity: • Inventory Turnover = CGS : Inventory • Average Collection Period = Accounts Receivable : (Annual sales/360) • Average Payment Period = Accounts Payable : (Annual sales/360) • Fixed Assets Turnover = Sales : Net Fixed Assets • Measures of Debt: • Degree of Indebtedness: Mengukur jumlah hutang thp jumlah • Types of Debt Measures komponen yang penting dalam neraca • Ability to Service Debts: Mengukur kemampuan perusahaan untuk • Melakukan pembayaran sesuai kontrak • Debt Ratio = Total Liabilties: Total Assets • Debt – Equity Ratio = Long Term Debt : Stockholders’ Equity • Times Interest Earned Ratio = EBIT : Interest
(EBIT + Lease Payments) Fixed Payment Coverage Ratio = ----------------------------------------------- Interest + Lease Payment + {[Principal Payments + Preferred Stock Dividends] x [ 1/ (1-T)]} Measures of Profitability: Common Size Income Statements: Setiap item dalam Income Statements diprosentasekan terhadap Penjualan Gross Profit Margin = Gross Profits : Sales Operating Profit Margin = Operating Profits : Sales Net Profit Margin = EAT : Sales Return on Investment = EAT : Total Assets Return on Equity = EAT : Stockholders’ Equity Earnings Available for Common Stockholders Earnings Per Share = --------------------------------------------------------------- Number of Shares of Common Stock Outstanding Price / Earnings Ratio = Market Price Per Share of Common Stock : Earnings Per Share Two Approaches to Complete Ratio Analysis: DuPont System of Analysis. Summary Analysis of a Large Number of Ratios
SALES $3,074,000 CGS $2,088,000 OPERATING EXPENSES $1,074,000 NET PROFIT $231,000 NET PROFIT MARGIN 7.5% INTEREST EXPENSES $93,000 SALES $3,074,000 ROI 6.4 % TAXES $94,000 SALES $3,074,000 CURRENT ASSETS $1,223,000 TOTAL ASSETS TURNOVER 0.85 TOTAL ASSETS $3,597,000 ROE 11.8 % NET FIXED ASSETS $2,374,000 CURRENT LIABILITIES $620,000 TOTAL LIABILITIES + STOCKHOLDERS’ EQUITY = TOTAL ASSETS $3,597,000 TOTAL LIABILITIES $1,643,000 EQUITY MULTI PLIER 1.84 LONG TERM DEBT $1,023,000 STOCKHOLDERS’ EQUITY $1,954,000 STOCKHOLDERS’ EQUITY $1,954,000 DUPONT SYSTEM OF ANALYSIS
Summary of Barlet Oil Company (1989 – 1991) Including 1991 Industry Average
Summary of Barlet Oil Company (1989 – 1991) Including 1991 Industry Average
PROBLEMS I. Balance Sheet Completion Using Ratio. Complete the 2008 balance sheet for O’Keefe Industries using the information that follows it.
II. Go to idx or jsx Website. Find the financial statement for 5 years. Analyse them and make a conclusion.