T-Test
T-Test. The purpose of t test (Gosset, 1908) is to compare two means. It assesses whether two means are statistically different. It can assess the difference between two groups or two variables. Limitations.


T-Test
E N D
Presentation Transcript
T-Test • The purpose of t test (Gosset, 1908) is to compare two means. • It assesses whether two means are statistically different. • It can assess the difference between two groups or two variables.
Limitations • It assumes that the data are normally distributed (e.g., Wilk-Shapiro normality test) • It assumes that there is equality of variances between groups (e.g., F test, or more robust Levene's test) • It is highly sensitive to sample sizes (need n>30) • It only can be used to compare two groups. If used to compare more than 2 groups, we may incur a type-I error.
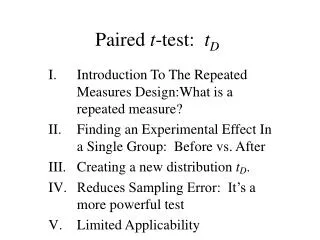
T-Test Models • Independent-samples t test (independent means): Compares the means of one variable for two groups. • Paired-samples t test (dependent means): Compares the means of two variables for a single group.
Independent-samples t test • It compares means for two groups of cases. • Used in survey studies with different groups (e.g., teachers and administrators) to assess whether there are differences in responses or scores between the two groups.
Example - Independent Samples • Used in experimental studies, in which subjects are randomly assigned to two groups (treatment and control), to assess whether differences are found between groups before the intervention (equivalence) • Question: Are the two groups of students (treatment and control) the same on key characteristics (e.g., reading pre-test score) before the intervention?
Procedures • Analyze Compare means Independent-samples t test Test variables: select the variables Grouping variable: select the group variable Define groups: type codes (e.g., control=0, treatment=1) Click Continue, then OK
An example • Dataset: Survey3ED.sav (Pallant) • Use t test to assess whether there are significant differences between males and females on their self-esteem levels • The grouping variable will be: Gender. • Check data (Ns for each group, missing data? Coding?) • Check assumptions (e.g., Levene’s test for equality of variances)
Survey3ED example (continued) • Assess differences between groups • Calculate effect sizes • Present results
Are we having fun? • Based on your research interests, what research questions would require an independent samples t-test? • Try it out!
Paired-samples t test • It is commonly used in quasi-experimental or "pre-post" design. • Pre-post designs consists of two measurements taken on the same subjects, one before and one after the introduction of a treatment or intervention. • If the treatment had no effect, the average difference between the measurements is equal to 0 and the null hypothesis holds. • If the treatment had an effect (intended or unintended!), the average difference is not 0 and the null hypothesis is rejected.
Example Paired-Samples • Used in experimental studies, in which subjects are randomly assigned to two groups (treatment and control), to assess whether differences are found between groups after the intervention (pre-post impact) • Research Question: Will students randomly assigned to the reading intervention improve their reading outcomes significantly more than students randomly assigned to the control group?
Procedures • Analyze Compare Means Paired-Samples T Test Paired variables: Select pre-post variables Options: Confidence interval: 95% Missing values: exclude cases analysis by analysis
An example • Dataset: experim3ED.sav (Pallant) • Use t test to assess whether there are significant differences between students’ confidence in their ability to successfully complete a statistics course following the intervention. • The grouping variable will be: Time. • Check data (Ns for each group, missing data? Coding?) • Check assumptions (e.g., Levene’s test for equality of variances, plus difference between scores are normally distributed, n>30)
Experim3ED example (cont.) • Determine overall significance (p<.05) • Compare mean values – which is higher? T1 or T2? • Limitation: No treatment/control groups • PCVs – Potentially confounding variables • Calculate effect size • Present results
Are we (still) having fun? • Based on your research interests, what research questions would require a paired samples t-test? • Try it out!