Water Accounts
110 likes | 317 Vues
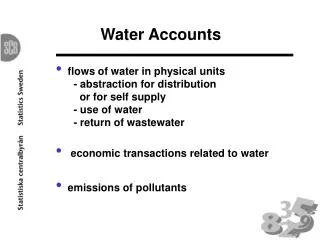
Water Accounts. flows of water in physical units - abstraction for distribution or for self supply - use of water - return of wastewater economic transactions related to water emissions of pollutants. Surface. water. Groundwater. Seawater. Collection, purification .

Water Accounts
E N D
Presentation Transcript
Water Accounts • flows of water in physical units - abstraction for distribution or for self supply - use of water - return of wastewater • economic transactionsrelated to water • emissions of pollutants
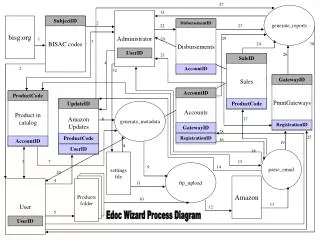
Surface water Groundwater Seawater Collection, purification distribution of water NACE 41 Agriculture Mining and manufacturing industries Households NACE 01 NACE 10 - 39 NACE 70 Figure 1 Flow of water in the Swedish technosphere Unspecified g round water or s u r face water 1938 224 505 Freshwater 2 667 546 8 500 89 1404 135 97 ? 942 Nuclear power 500 plants 46 NACE 40.1 203 91 3 117 Electricity, gas et c . Other industrial sectors Leakage, NACE 40 losses, NACE 02, 42 - 99 own use 2 117 526 65 ? ? Wastewater disposal Urban r un - off NACE 90.001 653 water 89 749 1030 ? 614 4 6 93 Returns to freshwater Returns to non - fresh water
Source of information, physical data Data included Survey Svenskt Vatten AB 1997 ·total population ·population connected to public water system ·population connected to public sewage system ·abstraction from ground-water or surface water ·purchase or sale of water to other municipalities ·use of water in industry, households, public use, own use in waterworks and losses SCB surveyManufacturing industry, 1995, 2000 Non-market produced/ self supply of water Real estate assessment register, yearly Self supplyHouseholds SCB agriculture survey 1985 Water for irrigation Estimation based on livestock, agricultural statistics survey 1999 Water for livestock TRK – report Nitrogen net loads SCB database, year 2000. Discharges to water and sludge Wastewater and wastewater treatment
Source of information, monetary data Data included The municipal accounts, a yearly survey Revenues, investments and expenditure for production of water and wastewater treatment. A division between data for municipal waterworks and waste water is not possible. Business statistics, yearly Costs and revenues within NACE 41 (Collection, purification and distribution of water) and 90001 (Sewage disposal). Survey from the trade association for Swedish water utilities, the Swedish Water and Wastewater Association, Svenskt Vatten AB, 1997 Municipal tariffs for water and wastewater for household in a one-family building, including information of the percentage cost for water and for wastewater treatment respectively. No collection on tariffs for industries. Selected data from Environmental protection expenditure in industry 1999/2000 Expenditure for self-supply of water and of wastewater treatment
Allocation to sea basins 1. Environmental statistics are compiled for sea basins ‘Abstraction and use of water in the manufacturing industry’ and ‘Discharges to water and sludge production in 2000 by municipal wastewater treatment plants and some coastal industry’ are compiled for drainage basins. 2. Information on real estate and population with geographical location of the basic data The real estate register contains information on x, y coordinates, which by using geographic information systems (GIS) can be allocated to a sea basin. 3. Allocation of municipality data to Sea basins By using GIS, it is possible to combine digital maps for municipalities, localities and sea basins. 119 municipalities were entirely within one sea basin, 165 municipalities intersected with a minor part and 5 municipalities were split between two sea basins. For these 5, data were disaggregated according to the percentage of the population in urban areas. This method was used for data concerning the supply and use of distributed water, both physical and monetary data. 4. Using environmental expenditure data together with distribution keys Environmental expenditure in the manufacturing industry contains data on investments and expenditure for wastewater. The data referred to companies. One company can have several establishments in different sea basins. The expenditure for each industry was allocated in relation to the quantities of discharged water from the survey on water use.
Summary • Regionalizeto water district • Simplify tables to provide overview • Collect water use data each 3-5 years • Supplement with diffuse sources such as leakage of nitrogen from agriculture land • Couple the data to driving forces for modelling