Digital Signaling
200 likes | 226 Vues
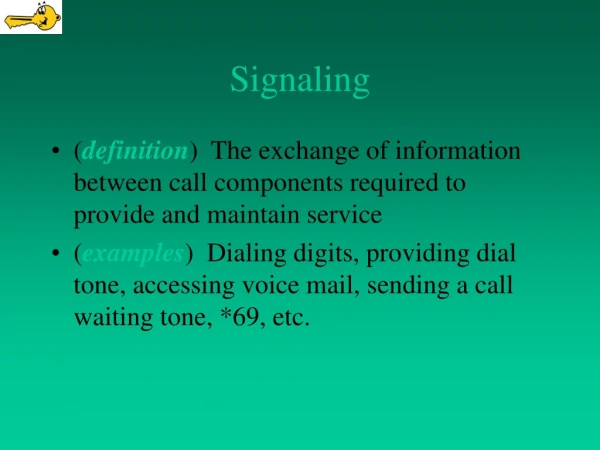
Digital Signaling. Digital Signaling Vector Representation Bandwidth Estimation Binary Signaling Multilevel Signaling. Huseyin Bilgekul Eeng360 Communication Systems I Department of Electrical and Electronic Engineering Eastern Mediterranean University. Digital Signaling.

Digital Signaling
E N D
Presentation Transcript
Digital Signaling • Digital Signaling • Vector Representation • Bandwidth Estimation • Binary Signaling • Multilevel Signaling Huseyin Bilgekul Eeng360 Communication Systems I Department of Electrical and Electronic Engineering Eastern Mediterranean University
Digital Signaling • How do we mathematical represent the waveform of a digital signal? • How do we estimate the bandwidth of the waveform? • Example: Message ‘X’ for ASCII computer keyboard - code word “0001101” • What is the data rate?
Digital Signaling Binary (2) Values Binary signal Multilevel signal More than 2 Values • Baud (Symbol Rate) : • D = N/T0 symbols/sec ; N- number of dimensions used in T0 sec. • Bit Rate : • R = n/T0 bits/sec ; n- number of data bits sent in T0 sec.
How to detect the data at the receiver (after transmission over a channel)? • Formal way is to evaluate the orthogonal series coefficient. It is also true that eq. (3-30) is the optimal way of detecting the received signal that is corrupted by AWGN noise. This is known as Match Filtering or Matched Filter Detection.
Vector Representation • Orthogonal function space corresponds to orthogonal vector space :
Vector Representation of a Binary Signal • Examine the representation in next slide for the waveform of a 3-bit (binary) signal. This signal can be directly represented by, . • Orthogonal function approach
Vector Representation of a Binary Signal A 3 bit Signal waveform Bit shape pulse Orthogonal Function Set Vector Representation of the 3 bit signal
Bandwidth Estimation wk takes only BINARY values Waveform: • The lower bound for the bandwidth of the waveform w(t) is given by the Dimensionality Theorem • Binary Signaling: Example: Binary signaling from a digital source: M=256 distinct messages M = 2n = 28 = 256 Each message ~ 8-bit binary words T0=8 ms – Time taken to transmit one message; Code word: 01001110 w1= 0, w2= 1, w3= 0, w4= 0, w5= 1, w6= 1, w7= 1, w8= 0 • Case 1: Rectangular Pulse Orthogonal Functions: : unity-amplitude rectangular pulses;
Bandwidth Estimation (Binary Signaling) The Lower Bound : The actual Null Bandwidth: Bandwidth: Null BW > lower bound BW • Receiver end: How are we going to detect data? Orthogonal series coefficients wk are needed.Sample anywhere in the bit interval
Binary Signaling Lower bound BW: For N=8 pulses, T0=8 ms => B=500Hz. • Case 2: sin(x)/x Pulse Orthogonal Functions Minimum Bandwidth Where Ts=Tb for the case of Binary signaling. • Receiver end: How are we going to detect data? Orthogonal series coefficients wk are needed.Sample at MIDPOINT of each interval
Binary Signaling 0 1 0 01 1 1 To recover the digital data at the receiver, we sample received wavform at the right time instants (SYNCHRONIZATION) and from the sample values a decision is made about the value of the transmitted bit at that time instant.
Binary Signaling Which wave shape gives lower bound BW? 0 1 0 0 1 1 1 Individual Pulses Total Waveform
Binary Signaling Using Sa Shape 1 0 010
Multilevel Signaling • B Reduces, if N Reduces: So wk should take more than 2 values ( 2- binary signaling) • If wk’shave L>2 values Resultant waveform – Multilevel signal • Multilevel data : Encoding l-bit binary data into L-level :DAC
Multilevel Signaling (Example) M=256-message source ; L=4; T0=8 ms Encoding Scheme: A 2-Bit Digital-to-Analog Converter Binary Input Output Level (l=2 bits) (V) 11 +3 10 +1 00 -1 01 -3 Binary code word - 01001110 w1= -3, w2= -1, w3= +3, w4= +1 Bit rate : k bits/second Different Baud ( symbol rate): k baud Relation :
Multilevel Signaling - Example B=1/Ts=D=500 Hz B=N/2T0=250Hz • How can the data be detected at the receiver? • Sampling at midpoint of Ts=2 ms interval for either case (T=1, 3, 5, 7 ms)
Multilevel Signaling - Example 0 11 01 11 0 -3 +1 +3 +1 Total Waveform Individual Pulses
Binary-to-multilevel polar NRZ Signal Conversion • Binary to multilevel conversion is used to reduce the bandwidth required by the binary signaling. • Multiple bits (l number of bits) are converted into words having SYMBOL durations Ts=lTb where the Symbol Rate or the BAUD Rate D=1/Ts=1/lTb. • The symbols are converted to a L level (L=2l) multilevel signal using a l-bit DAC. • Note that now the Baud rate is reduced by l times the Bit rate R (D=R/l). • Thus the bandwidth required is reduced by l times. Ts: Symbol Duration L: Number of M ary levels Tb: Bit Duration l: Bits per Symbol L=2l D=1/Ts=1/lTb=R/l
Binary-to-multilevel Polar NRZ Signal Conversion (c) L = 8 = 23 Level Polar NRZ Waveform Out