Download
1 / 43
430 likes | 541 Vues
Investments in Human Capital: The People Based Economy. Kevin M. Murphy The University of Chicago September 3 , 2012. Background. U.S. Real Per Capita GDP 1889-2010. Where Does Growth Come From?. There are three primary sources of growth Investment in physical capital

E N D
Investments in Human Capital: The People Based Economy Kevin M. Murphy The University of Chicago September 3, 2012
Where Does Growth Come From? • There are three primary sources of growth • Investment in physical capital • Investment in human capital • Improvements in technology (knowledge) • Primary goals of policy should be to • Maintain the incentive for physical investment • Provide an environment that fosters the growth of human capital • Provide rewards for innovation
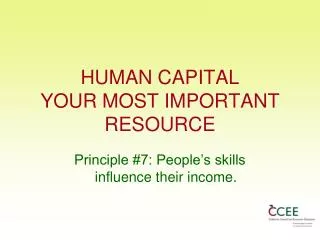
How do People Fit into the Economic Picture? • People are important as both inputs and outputs • Human capital is our most important input • Accounts for roughly 65 percent of our productive capacity • With increasingly mobile capital and technology, countries will be increasingly defined by their human capital • The production and maintenance of human capital is our most important output • Education • Healthcare • On the job training
People Have Been at the Center of Some of the Most Important Economic Developments of Our Lifetimes • Increases in the return to education and skills have revolutionized labor markets and society • Improvements in health and longevity have added as much value to peoples lives as have increases in material wealth • Technological changes have increased the value of education outside of the workplace as well
The Rising Importance of Education(Based on Becker & Murphy 2007)
Explaining Changes In Education Returns Using Supply & Demand • Growth in the college premium can be explained by a very simple model • Model based on Katz-Murphy 1992 • The model: • Demand grows steadily over time • Fluctuations in supply cause education premiums to fluctuate • Supply grows faster than demand premium falls • Demand grows faster than supply premium rises
The Supply Response • Growth in the college premium has generated a predictable response – more people have gone on to college
Education & Gender(Becker Hubbard & Murphy 2010) • While the fraction of individuals going on to college has increased over time the fraction graduating has not kept pace • The most likely reason is that many students are not well prepared • This is particularly true for young men • As a result of this and other factors college graduation rates for men are falling behind those for women
Mean GPA of High School Graduates, High School Transcript Studies
DISTRIBUTION OF FIRST-YEAR UNDERGRADUATE GPA, BEGINNING POSTSECONDARY STUDENTS LONGITUDINAL STUDY
Education & the Household(Becker & Murphy 2008) • Over time education has become more important in the household as well • Education based differences in health and longevity have increased in recent decades • More home based and out-patient care • Increases in drug therapies and patient monitoring • Education plays and important role in many other household activities • Financial decision making • Care and education of children
Basic Results • Historical improvements in life expectancy have been very significant – improvements in longevity from 1970 to 2000 were worth roughly $95 trillion (or about $3.2 trillion per year) to U.S. citizens • Improvements in life expectancy have contributed about as much to overall welfare as have improvements in material wealth
Basic Results (cont.) • Potential future gains are also very large: • A 10% reduction in cancer death rates is worth roughly $4.7 trillion to the U.S. alone • Reducing cardiovascular disease deaths by 10% is worth roughly $5.7 trillion U.S. alone • Worldwide benefits would be several multiples of that • Even modest progress has great value: • A 10% reduction in cancer deaths worth over $4.5 trillion • Historical reduction in heart disease from 1970 to 2000 was worth about $35 trillion • A 10% reduction in accident related deaths is worth about $1.4 trillion
Figure 3: Values of 1/10,000 Reduction in Death Rates $800 $700 $600 Value of a 1/10,000 Reduction In Death Rates $500 $400 $300 $200 $100 $0 0 10 20 30 40 50 60 70 80 90 100 110 Age
Caveats to the Net Gains Analysis • Gains include improvements from many margins not just health care • Health care costs include many expenditures other than those directed at longevity • However, the comparison allows us to compare the size of two important trends
Longer Term Changes • Recent improvements are reflective of longer term gains in longevity • Gains were actually somewhat greater in earlier decades using a fixed valuation profile (like fixed basis GNP accounting) • Gains have become increasingly concentrated at older ages in recent decades
Gain from a Permanent 10% Reduction in Death Rates by Category of Disease(Billions of $2004) Females Males Total ALL CAUSES $10,651 $7,885 $18,536 MAJOR CARDIOVASCULAR DISEASES $3,254 $2,471 $5,725 DISEASES OF HEART $2,676 $1,852 $4,529 CEREBROVASCULAR DISEASES $393 $460 $852 MALIGNANT NEOPLASMS $2,415 $2,261 $4,675 RESPIRATORY AND RELATED ORGANS $847 $557 $1,404 BREAST $3 $444 $447 REPRODUCTIVE AND URINARY ORGANS $301 $302 $603 DIGESTIVE ORGANS $575 $431 $1,006 INFECTIOUS DISEASES (Including AIDS) $500 $148 $649
Gain from a Permanent 10% Reduction in Death Rates by Category of Disease(Billions of $2004) (Continued) Males Females Total
Important Policy Questions • How do we take advantage of growing demand for education and skills? • Increasing investment in higher education • Improving education at lower levels • How do we take advantage of potential gains from medical advance? • Balancing the costs and benefits • Improving insurance • Talking advantage of scalable technologies and the world-wide growth in incomes