Download

1 / 31
320 likes | 468 Vues
A 150 MHz Survey using GMRT and MWA data sets. N. Udaya Shankar Raman Research Institute MWA Collaboration Meeting Canberra January 19-23, 2009. A 150 MHz Survey using GMRT and MWA data sets. N. Udaya Shankar , RRI, R. Subrahmanyan, RRI, Bryan Gaensler, University of Sydney

E N D
A 150 MHz Survey using GMRT and MWA data sets. N. Udaya Shankar Raman Research Institute MWA Collaboration Meeting Canberra January 19-23, 2009
A 150 MHz Survey using GMRT and MWA data sets. N. Udaya Shankar , RRI, R. Subrahmanyan, RRI, Bryan Gaensler, University of Sydney Randall Wayth Harvard, CFA Andrew Hopkins, University of Sydney Melanie Johnston-Hollitt, University of Tasmania Shami Chatterjee, University of Sydney Divya Oberoi MIT, Haystack MWA GEG
Main Goal: Survey A Radian of the sky around the zenith of angle of MWA, where its sensitivity is maximum. Frequency: 150 MHz Declination Range: -500 to +100 RA Range: Entire 24 hours of RA Polarisation: Full Stokes To cover the 5.9 steradians of the sky the survey using GMRT requires 2150 pointings. Total collecting Area of MWA equivalent of 10 GMRT dishes operating with a 50% efficiency at 150 MHz.
MWA will generate low resolution, confusion limited images but with excellent surface brightness sensitivity. GMRT gives high resolution and high sensitivity images but not sensitive to extended features due to its configuration and high RFI at low frequencies severely affecting short baselines. A survey combining GMRT and MWA data sets will yield images at meter wavelengths with unprecedented surface brightness sensitivity Equivalent of 0.5 mJy /arcmin2at 1.4 GHz Combined with high angular resolution = 20’’ Point source sensitivity = 1.5 mJy at 1 Sigma- level.
A survey combining GMRT and MWA data sets will yield images at meter wavelengths with unprecedented surface brightness sensitivity Equivalent of 0.5 mJy /arcmin2at 1.4 GHz Combined with high angular resolution = 20’’ Point source sensitivity = 1.5 mJy at 1 Sigma- level. Equivalent numbers for 6C, 7C, WENSS, SUMSS, NVSS, PMN are ~ 5 mJy /arcmin2 at 1.4 GHz Equivalent sensitivities of NVSS, WENSS and VLSS at 150 MHz are 3, 7.4, 57 mJy
The astrophysical significance of such a survey cannot be over emphasized. Science that can be done with such a survey overlap with the main scientific goals of LOFAR and the 74 MHz system at the VLA. They are well documented GMRT Sky Surveys on their own at 150, 75 and 50 MHz will give the much sought after sky models (flux densities and spectral indices of point sources ) for calibration, Imaging and Foreground subtraction required for EoR detection using MWA.
MRT 1 km 2 km The Mauritius Radio Telescope (Bras d’Eau Latitude 200.14 S Longitude 570.73 E) http://www.rri.res.in/htmls/aa/mrt.html
Scientific Objectives • Southern Sky Survey - declination range –700 to –100 • Frequency 151.5 MHz, bandwidth 1 MHz • Angular Resolution – 4’x4’ • Point source sensitivity – 200-300 mJy beam-1 • Sky coverage ~ 4 Steradian • 20,000 hrs of observations have been carried out • 5000 hrs of data has been analysed • Images and Cat of a steradian of the sky is available on the RRI web for the astronomy community. • Principal products: - Wide field Images, including part of galactic plane • A catalog of Radio Sources
Image reliability • Noise • Comparison with • Radio surveys • Radio source counts Positions Flux
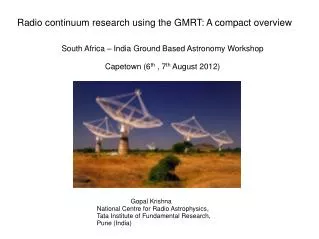
Giant Metre-wave Radio Telescope (GMRT) 30 antennas, each of 45 meter diameter, spread over 30 km area, Collecting area 60,750m2 16 Antennas are distributed in a nearly ‘Y’ shaped array and the remaining 14 antennas are randomly distributed in the central 1 km region.
However we still prefer using the MWA data set for short spacings for three main reasons: (1) Simulations indicate that baselines less than 200 m are hardly sampled by GMRT antennas even after rotational synthesis. (2)RFI environment near the observatory severely restricts the data quality of short baselines. (3) The MWA is located in a radio quite zone and is expected to have an interference free environment for its operation.
As per the GMRT System parameters and current status available on the GTAC website the best rms sensitivities achieved so far with GMRT at 150 MHz is 1.5 mJy. Our experience and discussions with my colleagues who have used GMRT extensively indicate that this rms can be achieved in about an hour of integration time while imaging only point sources for 5 MHz BW, 10 m integ, 27 ant, 600K Tsys, expected rms is 1.5mJy/beam It would require about 4-hr of integration to achieve the same rms while imaging extended sources.
Surveying Sensitivitiy: Taking into account that one requires at least one hour of integration per pointing to reach a 1.5 mJy rms in the images. The effective surveying speed is 364 hr/steradian. This is lower than the surveying speeds of VLSS (Cohen et al. 2007) by a factor of 3.8 (95 hr/steradian) and NVSS (Condon et al. 1998) by a factor of 1.4 (262 hr/steradian). However the sensitivity of the proposed survey is 38 times better than the sensitivity of VLSS and twice that of NVSS We expect to see 20 times more sources per square degree at 150 MHz than VLSS (3 sources/square degree at 74 MHz) The same as that of NVSS (60 sources/square degree at 1.4 GHz).
Challenges Ahead Of Such a Survey: • Number of sources expected per primary beam is 500 • Polyhedron imaging: ~100 facets covering • ~4 deg primary beam • Additional facets to image bright sources further away from phase centre • 8-10 phase self cal iterations are generally required to get a Dynamic range ~1000-1500 • This problem is common to all other frequency bands of the GMRT
Full polarisation images are being made using GMRT for the first time at 150 MHz. It is not straight forward to combine MWA and GMRT data sets since they have different polarizations and also primary beams.
Since RFI is a major problem at these frequencies, procedures for automatic data flagging has to be developed to make data processing efficient. Recently efforts have been made to develop automatic flagging routines (Middelberg 2006). This will be adapted for our data analysis. Dynamic Spectrum Courtesy: Rutha and Dwarakanath
For the pilot survey we proposed to image an area overlapping two regions covered by The Spitzer Wide-area Infrared Extragalactic survey (SWIRE). The SWIRE Team performed an exhaustive search for high-latitude fields with low-background to maximize the sensitivity of the SWIRE Legacy Survey. Based on the availability of unique datasets at other wavelengths they selected four fields.
Of these we have chosen the Chandra Deep South survey field, since its filed center is close to the zenith at Murchison. Minimises problems in polarization calibration. This automatically led to the selection of ELAIS-S1 led as the other choice, as Australia Telescope Large Area Survey (ATLAS) has surveyed both CDFS and ELAIS-S1 fields. The addition of 150 MHz images will facilitate detailed multiwavelength investigations of these fields
The 14 pointings proposed for the pilot survey. (a) ELAIS S1field center, and (b) CDFS field center. Pointings in (a) are chosen based on the declination limit of GMRT.
A total of ~ 60 hrs of observing was carried out using GMRT in the month of August, 2008 • This included four hours of observing per pointing centre and four hrs in total for observing phase calibrators and 3C48 used for Band-pass and primary flux calibration • Each 5 deg X 5 deg was imaged dividing the primary beam into 58 fields to correct for non-coplanarity. • The preliminary results of comparing this 2deg X 2deg field with the NVSS is summarised in the following transparencies • Observing and data analysis carried out: • Wasim, Arvind and Udaya Shankar
Sources detected in the field 5- at GMRT = ~60 mJy. With 0.8 spectral index Equivalent cut-off at NVSS is ~10 mJy
Positional errors: RA ~35% of beam
Positional errors: DEC ~35% of beam
Sample • Larger collecting area and higher antenna efficiency means the low frequency GMRT system will be more sensitive than the 74 MHz VLA system.
There is no action with out interaction I invite the interested to join the GEG team for interaction related to Analysis of 60 hrs of data already collected RFI mitigation techniques, Automatic Data Editing, Imaging and analysis
Are we happy stopping at 10 m Jy RMS levels hit by the dynamic range limitations of GMRT? • Polarised calibrators are not available for polarisation calibration at these frequencies • Can we use pulsars for polarisation calibration? • Do we have sufficient number of strong pulsars in the fields to be used ?
A technique for polarisation calibration of GMRT has already been developed by Ue-Li Pen, Yashwanth and their collaborators (astro-ph July 2008). • They use software correlator at GMRT which are not yet released for user community? • How crucial is polarisation information for us? • If crucial can we approach them as a team to use software correlator for polarisation calibration?
Action:Based on these inputs prepare a survey document for submission to GTAC.Last date for submission: June 2009