Understanding Functional Genomics: Tools for Gene Expression and Regulation Analysis
This resource provides comprehensive insights into functional genomics, focusing on the measurement of gene activity under various conditions, RNA and protein abundances, and transcriptional regulatory networks. Key methods discussed include microarrays, RNA-seq, and protein interaction profiling. Learn how gene expression profiles can vary by individual, strain, or environmental condition, and discover the implications of these variations in biological research and disease states. Enhance your understanding of how biological information is organized and analyzed in a functional genomics context.

Understanding Functional Genomics: Tools for Gene Expression and Regulation Analysis
E N D
Presentation Transcript
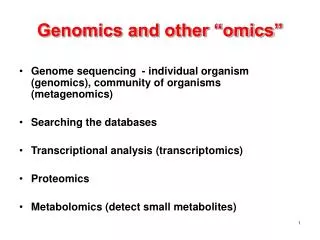
Functional Genomics and Omics datasets BMI/CS 576 www.biostat.wisc.edu/bmi576.html Sushmita Roy sroy@biostat.wisc.edu Nov 8th, 2012
Organization of biological information Organism Chromosome Tissue Cell Gene http://publications.nigms.nih.gov/thenewgenetics/chapter1.html
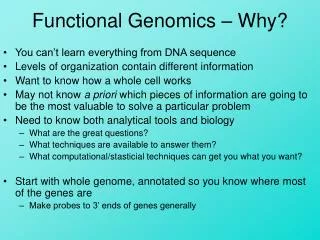
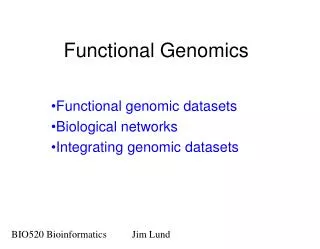
How to determine the function of a piece of DNA? • Measure activity under different conditions • RNA abundance • protein abundance • Measure how gene is “regulated” • Transcriptional regulatory networks • Measure what genes interacts under what conditions • Protein interactions • Metabolic interactions
Measuring RNA abundances mRNAs genes • what is varied: individuals, strains, cell types, environmental conditions, disease states, etc. • what is measured: RNA quantities for thousands of genes, exons or other transcribed sequences
Gene-expression profiles for yeast cell cycle • rows represent yeast genes • columns represent time points as yeast goes through cell cycle • color represents expression level relative to baseline (red=high, green=low, black=baseline) Spellman 1998
Gene-expression profiles for leukemia patients • rows represent genes • columns represent people with 2 subtypes of leukemia: ALL and AML
Gene-expression profiles for ovarian cancer samples Gillet et al., PNAS 2011
Gene-expression profiles for genes that induce differentiation Ivanova et al., Nature 2006
Measuring protein and metabolite abundances • in a similar manner, we can characterize cells in terms of protein or metabolite (small molecule) abundances • this is not as common as mRNA profiling, however, because the technology for doing it is not as mature
varied: individuals, strains, cell types, environmental conditions, disease states, etc. measured: RNA quantities technology: microarrays varied: same as above measured: protein quantities technology: 2D gel electrophoresis + mass spec varied: same as above measured: small molecule quantities technology: 2D gel electrophoresis + mass spec Measuring protein and metabolite abundances
Expression profiling • expression profiling provides a tool for answering a wide range of questions about the dynamics of cells • how active are various genes in different cell/tissue types? • how does the activity level of various genes change under different conditions? • stages of a cell cycle • environmental conditions • disease states • knockout experiments • what genes seem to be regulated together?
Measuring gene expression • Microarrays • cDNA/spotted arrays • Affymetrix arrays • Sequencing • RNA-seq
Microarrays • a microarray is a solid support, on which pieces of DNA are arranged in a grid-like array • Each piece is called a probe • measures RNA abundances by exploiting complementary hybridization • DNA from labeled sample is called target
Spotted vs. oligonucleotide arrays • spotted arrays: • synthesize samples of cDNA (full-length transcripts or shorter sequences) and then spot them onto array • 30,000 cDNAs per slide • oligonucleotide arrays: • synthesize sets of DNA oligonucleotides(short, fixed length sequences, typically 25-60 nucleotides in length) on array itself (in situ) • Affymetrixuses a photolithography process similar to that used to make semiconductor chips • Nimblegen(in Madison) uses an array of millions of tiny mirrors + photo deposition chemistry • Presynthesized sequences can also be printed. • In both cases, mRNA is converted to DNA, labeled and hybridized, and detected by fluorescence scanning
gene 25-mers Oligonucleotide arrays • given a gene to be measured, select different n-mers for the gene • can also select n-mers for noncoding regions of the genome • selection criteria • specificity • hybridization properties • ease of manufacturing
cDNA Microarrays • RNA is isolated from matched samples of interest, and is typically converted to cDNA. It is labeled with fluorescent dyes,and then hybridized to the slide. Also look at this animation: http://www.bio.davidson.edu/courses/genomics/chip/chip.html
AGCGGTTCGAATACC TCGCGAAGCTAGACA CCGAAATAGCCAGTA Complementary hybridization • due to Watson-Crick base pairing, complementary single-stranded DNA/RNA molecules hybridize (bond to each other) UCGCCAAGCUUAUGG
TCGCCAAGCTTATGG Complementary hybridization • one way to do it in practice • put (a large part of ) the actual gene sequence on array • convert mRNA to cDNA using reverse transcriptase actual gene AGCGGTTCGAATACC cDNA reverse transcriptase UCGCCAAGCUUAUGG mRNA
Microarray measurements • we can’t detect the absolute amount of mRNA present for a given gene, but we can measure a relative quantity • for two color arrays, the measurements represent • For 1 color, expression level is the average of the difference between match and mismatch probes. • where red is the test expression level, and green is the reference level for gene G in the ith experiment
RNA-seq measurements • measurements are digital: counts of sequenced reads for each gene/transcript • still the measurements represent relative amounts of each transcript: the counts depend on how many reads are sequenced
A typical RNA-seq pipeline Wang et al, Nature Genetics 2009
RNA-seq vs. microarrays • advantages of RNA-seq • don’t need reference sequence for genes/genome being assayed • low background noise • large dynamic range (105 vs. 102 for microarrays) • high technical reproducibility • disadvantage • more expensive, but cost is rapidly falling
Several computational tasks • identifying differential expression: which genes have different expression levels across two groups • clustering genes: which genes seem to be regulated together • clustering samples: which treatments/individuals have similar profiles • classifying genes: to which functional class does a given gene belong • classifying samples: to which class does a given sample belong • e.g., does this patient have ALL or AML • e.g., does this chemical act like an AHR agonist, or a PCB or …
Measuring protein abundance levels • Mass spectrometry • Detects composition of a mixture based on mass to charge ratio of charged particles • MS shotgun proteomics • Like shotgun genomics • Take protein and digest into peptides using Trypsin • Measure what peptides are present • Align with database of protein sequences to infer identity of a peptide • Yeast also has a GFP fusion library • Could be used to measure protein expression per cell
Detecting physical interactions protein-DNA interactions protein-protein interactions
varied: cell types, environmental conditions etc. measured: protein-DNA interactions technology:ChIP-chip ChIP-seq varied: measured: protein-protein interactions technology: two-hybrid systems, mass spec High-throughput methods for detecting interactions
Yeast protein-protein interaction networks Barabasi et al. 2003 Red: lethal, green: non-lethal, yellow: slow growth
Structure of genes DNA Gene A Gene B Gene C Non-coding Gene Promoter
Protein-DNA interaction example • goal: determine the (approximate) locations in the genome where a given protein binds • ChIP-seq binding profiles for two transcription factors in the neighborhoods of several developmental genes
Regulatory network of some model organisms S. cerevisiae: E. coli 153 TFs (green & light red), 1319 targets 157 TFs and 4410 targets Vargas and Santillan, 2008
Measuring Genetic interactions Dixon et al., 2009
Yeast genetic interaction network Costanzo et al, 2011
Protein-DNA and protein-protein interactions can lend insight into functional organization Ideker et al., Science 2001
varied: single (or pairs) genes knocked out or suppressed measured: some “reporter” quantity of interest technology: deletion libraries, RNA interference varied: individuals measured: variation at specific genome locations technology: SNP chips, etc. More high-throughput methods