MONITORING AND DIAGNOSIS
400 likes | 603 Vues
Key Operability issues 1. Operating window 2. Flexibility/ controllability 3. Reliability 4. Safety & equipment protection 5. Efficiency & profitability 6. Operation during transitions 7. Dynamic Performance 8. Monitoring & diagnosis. MONITORING AND DIAGNOSIS.

MONITORING AND DIAGNOSIS
E N D
Presentation Transcript
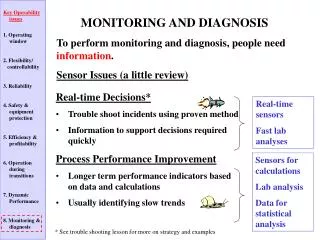
Key Operability issues 1. Operating window 2. Flexibility/ controllability 3. Reliability 4. Safety & equipment protection 5. Efficiency & profitability 6. Operation during transitions 7. Dynamic Performance 8. Monitoring & diagnosis MONITORING AND DIAGNOSIS To perform monitoring and diagnosis, people need information. Sensor Issues (a little review) • Real-time Decisions* • Trouble shoot incidents using proven method • Information to support decisions required quickly • Process Performance Improvement • Longer term performance indicators based on data and calculations • Usually identifying slow trends Real-time sensors Fast lab analyses Sensors for calculations Lab analysis Data for statistical analysis * See trouble shooting lesson for more on strategy and examples
Sensors Key Operability issues 1. Operating window 2. Flexibility/ controllability 3. Reliability 4. Safety & equipment protection 5. Efficiency & profitability 6. Operation during transitions 7. Dynamic Performance 8. Monitoring & diagnosis MONITORING AND DIAGNOSIS Sensors Selecting sensor technology • Achieve required accuracy and reproducibility • Achieve required reliability • - Functions well for range of process environments • - Protect from damage (e.g., thermowell) or sample • from process and measure in less harsh conditions • - Redundancy, if required • - Redundancy with diversity, if required • Provide means for calibration and maintenance • Balance cost (capital,maintenance and operating) with benefit to achieve economic return http://www.pc-education.mcmaster.ca/instrumentation/go_inst.htm(Select 2.0 Sensors)
Sensors all other analysis level flow Key Operability issues 1. Operating window 2. Flexibility/ controllability 3. Reliability 4. Safety & equipment protection 5. Efficiency & profitability 6. Operation during transitions 7. Dynamic Performance 8. Monitoring & diagnosis temperature pressure all other flow analysis level pressure temperature MONITORING AND DIAGNOSIS Sensors Sensors used for plant control Sensors used for plant display andmonitoring Higham, E.H., A Route to Better Process Measurements, I.Chem.E. Hazards X - Process Safety in Fine Chemical and Specialty Plants, 1989. (Current practice might include more on-stream analysis.)
Sensors Key Operability issues 1. Operating window 2. Flexibility/ controllability 3. Reliability 4. Safety & equipment protection 5. Efficiency & profitability 6. Operation during transitions 7. Dynamic Performance 8. Monitoring & diagnosis MONITORING AND DIAGNOSIS Sensors Class exercise on sensors You have been asked to evaluate the performance of a process. You will use all forms of data, from trend to historical reports. What are some of the questions that you might to ensure that you interpret the sensor data correctly? Why should I ask questions? Every data value is exact, at least to the number of significant figures on the plot or in the numerical display!
Sensors Key Operability issues 1. Operating window 2. Flexibility/ controllability 3. Reliability 4. Safety & equipment protection 5. Efficiency & profitability 6. Operation during transitions 7. Dynamic Performance 8. Monitoring & diagnosis MONITORING AND DIAGNOSIS Process Performance Improvements Class exercise: a. Sensor range • Most sensor accuracies depend on the range (or span). A sensor with a range of 1000 K has a poorer accuracy than one with a range of 100 K. • Some sensor accuracies depend on the position in the range. For example, an orifice meter has a very poor accuracy at 10% of maximum range. • Also, a flow meter can report a very small value when the flow is actually zero. • 3. If the measured value equals the maximum (minimum) of the range, the plant value could be much higher (lower) than the reported value.
Sensors Key Operability issues 1. Operating window 2. Flexibility/ controllability 3. Reliability 4. Safety & equipment protection 5. Efficiency & profitability 6. Operation during transitions 7. Dynamic Performance 8. Monitoring & diagnosis MONITORING AND DIAGNOSIS Process Performance Improvements Class exercise: b. Sensor Technology • Different sensors for the same process variable (P, T, F, L, etc) can have very different accuracies. For example, a RTD is much more accurate that a thermocouple. • Different sensor technologies are robust (sensitive) to changes in process conditions,such as suspended solids in a flowing fluid. This knowledge helps in anticipating potential sensor problems, sensor loss of accuracy and in trouble shooting process operation.
Sensors Key Operability issues 1. Operating window 2. Flexibility/ controllability 3. Reliability 4. Safety & equipment protection 5. Efficiency & profitability 6. Operation during transitions 7. Dynamic Performance 8. Monitoring & diagnosis MONITORING AND DIAGNOSIS Process Performance Improvements Class exercise: c. Measurement compensation. Several measurements can be used to provide a more accurate value for a single process variable. Orifice flow meters relate the pressure change across the orifice to the flow rate. The relationship depends on the fluid density. Either the density or gas pressure and temperature can be used to correct for changes for an assumed (design) value. You need to know whether or not this correction has been performed. Is this measured and used in the calculation, or is the value assumed constant (at the design value?)
Real-time Key Operability issues 1. Operating window 2. Flexibility/ controllability 3. Reliability 4. Safety & equipment protection 5. Efficiency & profitability 6. Operation during transitions 7. Dynamic Performance 8. Monitoring & diagnosis MONITORING AND DIAGNOSIS Real-time Decisions We have learned the importance of measurements in trouble shooting. • During process design, we need to brainstorm a list of likely faults that will require trouble shooting • Faults in sensors are expected and can easily mislead personnel. Select reliable sensors that match process environment and add redundancy where appropriate. • For each, the diagnosis procedure can be documented (and used for training and manual writing). Fishbone diagrams aid the thought process and documentation. • We need to ensure that the required measurements (sensors and laboratory) are provided to support successful trouble shooting!
Real-time Key Operability issues 1. Operating window 2. Flexibility/ controllability 3. Reliability 4. Safety & equipment protection 5. Efficiency & profitability 6. Operation during transitions 7. Dynamic Performance 8. Monitoring & diagnosis MONITORING AND DIAGNOSIS Real-time Decisions We select measurements based on an analysis of design goals and possible incidents Root cause 1 • Significant Incident # 3 • Safety • Equipment damage • Environmental impact • Product quality • Production rate • Profitability Root cause 2 • • • • • Root cause n Select measurements that enable operations personnel to uniquely determine the most likely root causes of every significant incident.
Real-time TC 1 Key Operability issues 1. Operating window 2. Flexibility/ controllability 3. Reliability 4. Safety & equipment protection 5. Efficiency & profitability 6. Operation during transitions 7. Dynamic Performance 8. Monitoring & diagnosis MONITORING AND DIAGNOSIS Real-time Decisions • Balancing Function and Cost – Location of sensors • Control room Displayed & Automatic Control • The variable is required to achieve one of the control objectives for the process. • Necessary information for the controller can be measured. Variable should be monitored reliably and rapidly. • Rapid and reliable feedback is required. • Automated action may be discrete or continuous. • Manipulated variable can be adjusted automatically • Stored in computer history and available on trend plot • All of above applies to safety shutdown as well as modulating control.
Real-time T Key Operability issues 1. Operating window 2. Flexibility/ controllability 3. Reliability 4. Safety & equipment protection 5. Efficiency & profitability 6. Operation during transitions 7. Dynamic Performance 8. Monitoring & diagnosis 2 MONITORING AND DIAGNOSIS Real-time Decisions • Balancing Function and Cost – Locations of sensors • Control room Displayed • Variable need not be controlled automatically; can be used to monitor process/equipment performance • If controlled, slowly by operator action is acceptable • If controlled, manipulated variable adjusted from control room (“manual” station to change valve % open or motor on/off) • Stored in computer history and available on trend plot
Real-time Key Operability issues 1. Operating window 2. Flexibility/ controllability 3. Reliability 4. Safety & equipment protection 5. Efficiency & profitability 6. Operation during transitions 7. Dynamic Performance 8. Monitoring & diagnosis MONITORING AND DIAGNOSIS Real-time Decisions • Balancing Function and Cost – Location of sensors • Locally Displayed • Variable need not be controlled; can be used to monitor process/equipment performance • Operator must travel to unit to observe the display • Used to monitor slowly changing process/equipment performance, for example, heat exchanger fouling and pressure drops in packed beds • Can be used for trouble shooting when rapid response is not required • Not stored in computer history - can be recorded on written log very infrequently (1/shift or day) T 3
Real-time Key Operability issues 1. Operating window 2. Flexibility/ controllability 3. Reliability 4. Safety & equipment protection 5. Efficiency & profitability 6. Operation during transitions 7. Dynamic Performance 8. Monitoring & diagnosis MONITORING AND DIAGNOSIS Real-time Decisions Real-time data is used to determine the “health” of the process.Use your process knowledge! For a chemical reaction with a significant heat of reaction (endo- or exothermic), the temperature change across the reactor provides an inference of the extent of reaction. Very useful, especially when on-stream analysis is not practical Hydrocracker reactions are highly exothermic Runaway is possible.
Real-time Key Operability issues 1. Operating window 2. Flexibility/ controllability 3. Reliability 4. Safety & equipment protection 5. Efficiency & profitability 6. Operation during transitions 7. Dynamic Performance 8. Monitoring & diagnosis MONITORING AND DIAGNOSIS Real-time Decisions Real-time data is used to determine the “health” of the process.Use your process knowledge! For semi-batch (batch-fed) bio-reactor, the off-gas flow rate and composition can be used to monitor the “health” of the reaction system – should the batch continue to completion or be aborted? PC TC Gas produced by the biological process FC fo fc L fo CW fo
Real-time Key Operability issues 1. Operating window 2. Flexibility/ controllability 3. Reliability 4. Safety & equipment protection 5. Efficiency & profitability 6. Operation during transitions 7. Dynamic Performance 8. Monitoring & diagnosis MONITORING AND DIAGNOSIS Real-time Decisions Real-time data is used to determine the “health” of process equipment.Use your knowledge of equipment. • Used for monitoring, display, and alarms to personnel • Used for SIS for safety and equipment protection • Equipment manufacturers often provide monitoring • Monitoring rotating equipment can include • Vibration • Temperature • Flow • Lubrication pressure • Power consumption Turbine Compressor T. Reeves, EPTQ, Q3, 2005 (www.eptq.com)
Real-time Key Operability issues 1. Operating window 2. Flexibility/ controllability 3. Reliability 4. Safety & equipment protection 5. Efficiency & profitability 6. Operation during transitions 7. Dynamic Performance 8. Monitoring & diagnosis MONITORING AND DIAGNOSIS Real-time Decisions Real-time data is used to determine the “health” of process equipment.Use your knowledge of equipment. • Used for monitoring, display, and alarms to personnel • Used for SIS for safety and equipment protection Figure shows schematic of monitor for pump and motor by T. Reeves, EPTQ, Q3, 2005 (www.eptq.com)
Real-time Key Operability issues 1. Operating window 2. Flexibility/ controllability 3. Reliability 4. Safety & equipment protection 5. Efficiency & profitability 6. Operation during transitions 7. Dynamic Performance 8. Monitoring & diagnosis MONITORING AND DIAGNOSIS Real-time Decisions Real-time data is used to determine the “health” of process equipment.Use your knowledge of equipment. In a chemical reactor, poor flow distribution can lead to “hot spots” that can damage catalyst or even the reactor vessel. Locating many temperature sensors at various locations in the bed provides monitoring for poor flow distribution. Used for monitoring, alarms and control.
Real-time Key Operability issues 1. Operating window 2. Flexibility/ controllability 3. Reliability 4. Safety & equipment protection 5. Efficiency & profitability 6. Operation during transitions 7. Dynamic Performance 8. Monitoring & diagnosis FR FV MONITORING AND DIAGNOSIS Real-time Decisions We need information for process troubleshooting. Remember that people are the ultimate backup protection; they have to correct for equipment malfunctions. Class Workshop: Add the sensors required to monitor this distillation tower in real time. • Hints: • What limits must not be violated? • What incidents must we diagnose? • What equipment can fail? • What redundancy is needed? • Where should display be located?
Real-time Key Operability issues 1. Operating window 2. Flexibility/ controllability 3. Reliability 4. Safety & equipment protection 5. Efficiency & profitability 6. Operation during transitions 7. Dynamic Performance 8. Monitoring & diagnosis MONITORING AND DIAGNOSIS Real-time Decisions Class Workshop: Add the sensors required to monitor this distillation tower in real time. • Some thoughts: • pressure of closed vessel is very important • levels in the accumulators are unstable • trays can leak liquid to lower trays • trays can become blocked • internal flows can exceed hydraulic limits • utility streams are important (e.g., steam) • the composition of trays should have an expected profile • pumps can malfunction • cooling water temperature should be below maximum limit
Real-time Do we need to increase the capital costs with all theses sensors? Plus maintenance! Key Operability issues 1. Operating window 2. Flexibility/ controllability 3. Reliability 4. Safety & equipment protection 5. Efficiency & profitability 6. Operation during transitions 7. Dynamic Performance 8. Monitoring & diagnosis MONITORING AND DIAGNOSIS Real-time Decisions YES !!
Longer term Key Operability issues 1. Operating window 2. Flexibility/ controllability 3. Reliability 4. Safety & equipment protection 5. Efficiency & profitability 6. Operation during transitions 7. Dynamic Performance 8. Monitoring & diagnosis MONITORING AND DIAGNOSIS Process Performance Improvements • Many features of a process change slowly, over days, weeks or months • The performance of complex systems is often not obvious from direct observation of the data • Engineers can identify key process performance measures that can be calculated automatically and stored in history • Actions are based on careful analysis of the data and might require either minor changes or extensive plant changes, during shutdowns
Longer term Key Operability issues 1. Operating window 2. Flexibility/ controllability 3. Reliability 4. Safety & equipment protection 5. Efficiency & profitability 6. Operation during transitions 7. Dynamic Performance 8. Monitoring & diagnosis MONITORING AND DIAGNOSIS Process Performance Improvements Often, several measurements are used to calculate a key process variable from a complex process. Examples of performance measures are: • Yields from a reactor • Electricity consumption per kg feed • Total effluent (of water, sulfur, etc.) • Efficiency of equipment (turbine, compressor, fired heater, etc.) • Operating conditions for successful and unsuccessful batches • Inventory in plant(work in progress, feed, and finished products)
Longer term Key Operability issues 1. Operating window 2. Flexibility/ controllability 3. Reliability 4. Safety & equipment protection 5. Efficiency & profitability 6. Operation during transitions 7. Dynamic Performance 8. Monitoring & diagnosis MONITORING AND DIAGNOSIS Process Performance Improvements Engineers must understand the sensors used and the methods for data storage before deciding how to use the measurement data. • Each sensor has a physical principle affecting its accuracy and reproducibility • Data is stored in a history data base, but some information is lost • Some actions by people are also recorded • Some times, measurement and computing equipment fail
Longer term Exercise: What questions would we like to answer using the history data base? History data base Key Operability issues 1. Operating window 2. Flexibility/ controllability 3. Reliability 4. Safety & equipment protection 5. Efficiency & profitability 6. Operation during transitions 7. Dynamic Performance 8. Monitoring & diagnosis Display MONITORING AND DIAGNOSIS Process Performance Improvements • The historical data base typically contains • Sensor measured values • Events: Alarms, set point changes, controller mode and tuning changes, SIS activation • Calculated variables (defined and build by engineer) • Cause of SIS activation • Laboratory analysis
Longer term History data base Key Operability issues 1. Operating window 2. Flexibility/ controllability 3. Reliability 4. Safety & equipment protection 5. Efficiency & profitability 6. Operation during transitions 7. Dynamic Performance 8. Monitoring & diagnosis Display MONITORING AND DIAGNOSIS Process Performance Improvements • Some typical questions answered using the historical data base • How much feed did we process last week? • What was the yield of vinyl chloride monomer? • How much energy was consumed per 1000 kg of product? • What was the total release of sulfur from the plant last month? • What was the distribution of product quality, displayed as a histogram? • How much valuable hydrogen was diverted to fuel gas last week?
Longer term Key Operability issues 1. Operating window 2. Flexibility/ controllability 3. Reliability 4. Safety & equipment protection 5. Efficiency & profitability 6. Operation during transitions 7. Dynamic Performance 8. Monitoring & diagnosis MONITORING AND DIAGNOSIS Process Performance Improvements Storing ½ second data for 1000 measurements for 30 years is a lot of data! 1000 x 120 x 60 x 24 x 365 x 30 2 x 10¹² Therefore, the data base has several layers with data aggregated to reduce storage. While storage capacity and computer speeds will continue to increase, the basic design will likely persist for a long time because we don’t need every data point for many analyses.
MONITORING AND DIAGNOSIS Process Performance Improvements Typical structure Sampling periods and storage duration tailored to need. For example, SIS period is very fast (milliseconds) to diagnose fault. Special purpose systems Aggregation: Large amounts of data stored for long times. Data is taken periodically with long sampling periods, e.g., 5 minutes. Historian Data is stored with decreasing resolution, e.g., 3 days of 1/min, 7 days of 1/hr, 30 days 1/day DCS control system Trend plots are updated 1/sec for new data, but this high-frequency data is not stored for later recall.
Longer term Key Operability issues 1. Operating window 2. Flexibility/ controllability 3. Reliability 4. Safety & equipment protection 5. Efficiency & profitability 6. Operation during transitions 7. Dynamic Performance 8. Monitoring & diagnosis MONITORING AND DIAGNOSIS Process Performance Improvements • Some typical ways to aggregate a variable • Average (shift, daily, weekly, monthly) • Integration, e.g., total flow per day (for material or energy) • Maximum and minimum over a period • Standard deviation (or histogram) • Analysis can have multiple values • To aggregate several variables, use process insight • Calculate key process performance measures (efficiencies, yields, etc.)
Longer term History data base Key Operability issues 1. Operating window 2. Flexibility/ controllability 3. Reliability 4. Safety & equipment protection 5. Efficiency & profitability 6. Operation during transitions 7. Dynamic Performance 8. Monitoring & diagnosis Display MONITORING AND DIAGNOSIS Process Performance Improvements Class Exercise: Occasionally, a sensor fails or the history storage fails for a period of time. How does the aggregation method handle these situations?
Longer term History data base Key Operability issues 1. Operating window 2. Flexibility/ controllability 3. Reliability 4. Safety & equipment protection 5. Efficiency & profitability 6. Operation during transitions 7. Dynamic Performance 8. Monitoring & diagnosis Display MONITORING AND DIAGNOSIS Process Performance Improvements Class exercise: Periods when a reliable value is not available is marked questionable. • Reports should provide information on whether any data within the aggregation period was questionable. (Best if % of data that is questionable reported) • You need to determine how the algorithm deals with missing data (ignore, interpolate, use last good before, use first good after, etc.) when calculating results, such as average or total.
Longer term History data base Key Operability issues 1. Operating window 2. Flexibility/ controllability 3. Reliability 4. Safety & equipment protection 5. Efficiency & profitability 6. Operation during transitions 7. Dynamic Performance 8. Monitoring & diagnosis Display MONITORING AND DIAGNOSIS Process Performance Improvements Plant personnel also check local sensors periodically (per shift or day) and record values. This data can be stored on paper, or the values can be entered into a hand-held computer and transferred to the history data base.
Longer term History data base Key Operability issues 1. Operating window 2. Flexibility/ controllability 3. Reliability 4. Safety & equipment protection 5. Efficiency & profitability 6. Operation during transitions 7. Dynamic Performance 8. Monitoring & diagnosis Display MONITORING AND DIAGNOSIS Process Performance Improvements Plant personnel extract samples of material for laboratory analysis. This data can be stored on paper, or the values can be entered into the history data base. The time the sample was taken is essential information.
Longer term Key Operability issues 1. Operating window 2. Flexibility/ controllability 3. Reliability 4. Safety & equipment protection 5. Efficiency & profitability 6. Operation during transitions 7. Dynamic Performance 8. Monitoring & diagnosis Key process variable, e.g., Product quality Desired value Time MONITORING AND DIAGNOSIS Process Performance Improvements Class Exercise: The data changes from sample to sample. How do we determine when a “significant” change has occurred?
Longer term Key Operability issues 1. Operating window 2. Flexibility/ controllability 3. Reliability 4. Safety & equipment protection 5. Efficiency & profitability 6. Operation during transitions 7. Dynamic Performance 8. Monitoring & diagnosis Action limit Key process variable, e.g., Product quality Desired value Action limit Time MONITORING AND DIAGNOSIS Process Performance Improvements We can use principles of statistical process control (SPC) to monitor and decide when a significant change has occurred. Process personnel trouble shoot, diagnose and eliminate the cause “Shewhart Chart”
Longer term Key Operability issues 1. Operating window 2. Flexibility/ controllability 3. Reliability 4. Safety & equipment protection 5. Efficiency & profitability 6. Operation during transitions 7. Dynamic Performance 8. Monitoring & diagnosis MONITORING AND DIAGNOSIS Process Performance Improvements Class Workshop: In your first job, you are responsible for the heat exchangers and fired heater in this process. Design a monitoring procedure (with sensors and lab analyses). Heat exchange with process streams that must be cooled. feed tank fuel • Hints: • What can change? • Is it important for plant performance? • How does it affect measurements? • Define measurements and calculations. product
Longer term Key Operability issues 1. Operating window 2. Flexibility/ controllability 3. Reliability 4. Safety & equipment protection 5. Efficiency & profitability 6. Operation during transitions 7. Dynamic Performance 8. Monitoring & diagnosis MONITORING AND DIAGNOSIS Process Performance Improvements Class Workshop: In your first job, you are responsible for the reactor (and catalyst regenerator) in the process shown on the next slide. Design a monitoring procedure (with sensors and lab analyses). • Hints: • What can change? • Is it important for plant performance? • How does it affect measurements? Include laboratory samples for variables that might not be measured on-stream. • Define measurements and calculations.
Longer term COMPRESSOR OVERHEAD CONDENSER/ACCUMULATOR HIGH PRESSURE REACTOR PRODUCTS CONDENSER/ SEPARATER ABSORBER TAIL GAS FLUE GAS SPONGE OIL TOP DEETHANIZER ABSORBER P.A. LCGO P.A. HCGO P/A LCGO BPA P/A STRIPPER STEAM RAW C4'S GASOLINE ABSORBER MAIN FRACTIONATOR DEPROPANIZER HCGO C3'S P.A. LCGO AIR REACTOR EFFLUENT STEAM STEAM FRESH FEED BOTTOM P.A. DEBUTANIZER LCPA P/A BPA P/A FULL RANGE HCGO CAT NAPHTHA • Hints: • What can change? • Is it important for plant performance? • How does it affect measurements? • Define measurements and calculations.
Longer term Key Operability issues 1. Operating window 2. Flexibility/ controllability 3. Reliability 4. Safety & equipment protection 5. Efficiency & profitability 6. Operation during transitions 7. Dynamic Performance 8. Monitoring & diagnosis MONITORING AND DIAGNOSIS Real-Time & Process Performance Improvements • INDUSTRIAL PRACTICE • Standard measurement choices have been developed for most unit operations. • Some issues require advanced analysis, for example, pipeline leak detection, rotating machinery vibration, pump alignment/lubrication, compressor surge, etc. • Process performance monitoring has not been comprehensively studied. Opportunity exists for innovation, especially using statistical correlation to distinguish good/bad.
Key Operability issues 1. Operating window 2. Flexibility/ controllability 3. Reliability 4. Safety & equipment protection 5. Efficiency & profitability 6. Operation during transitions 7. Dynamic Performance 8. Monitoring & diagnosis MONITORING AND DIAGNOSIS To perform monitoring and diagnosis, people need information. Sensor Issues (a little review) • Real-time Decisions* • Trouble shoot incidents using proven method • Information to support decisions required quickly • Process Performance Improvement • Longer term performance indicators based on data and calculations • Usually identifying slow trends Real-time sensors Fast lab analyses Sensors for calculations Lab analysis Data for statistical analysis * See trouble shooting lesson for more on strategy and examples
Key Operability issues 1. Operating window 2. Flexibility/ controllability 3. Reliability 4. Safety & equipment protection 5. Efficiency & profitability 6. Operation during transitions 7. Dynamic Performance 8. Monitoring & diagnosis Now, you have the knowledge and skills to design innovative solutions! PROCESS OPERABILITY Achieving a Robust Design • The job is not done when the design functions for (only) a base case operation • Process structure and equipment must be designed to provide good operability • The engineer must understand process andequipment behavior to ensure operability. • The lowest initial cost design is not necessarily the design that gives the best economic return over the life of the project.