Download
1 / 1
10 likes | 138 Vues
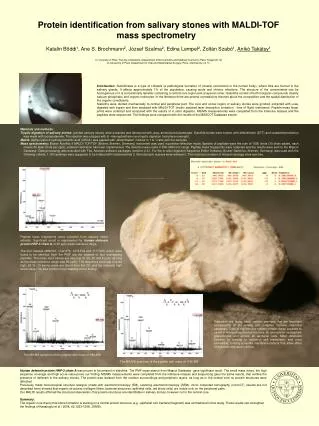
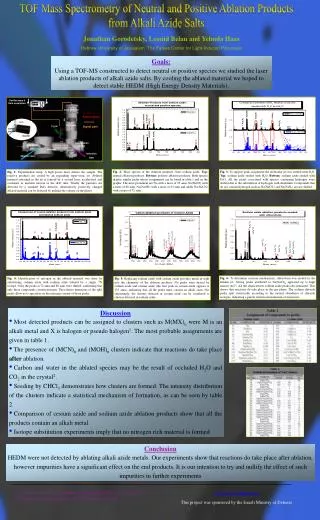
Oscilloscope & Data acquisition. Daly detector. Particle path. NaN 3. Drift tube. trigger. Signal path. sample holder. reactor. Acceleration plates. gas valve. skimmer. Ionization laser. Ablation laser. TOF Mass Spectrometry of Neutral and Positive Ablation Products

E N D
Oscilloscope & Data acquisition Daly detector Particle path NaN3 Drift tube trigger Signal path sample holder reactor Acceleration plates gas valve skimmer Ionization laser Ablation laser TOF Mass Spectrometry of Neutral and Positive Ablation Products from Alkali Azide Salts Jonathan Gorodetsky, Leonid Belau and Yehuda Haas Hebrew University of Jerusalem, The Farkas Center for Light-Induced Processes Goals: Using a TOF-MS constructed to detect neutral or positive species we studied the laser ablation products of alkali azide salts. By cooling the ablated material we hoped to detect stable HEDM (High Energy Density Materials). Fig. 2: Mass spectra of the ablation products from sodium azide. Top: neutral ablation products. Bottom: positive ablation products. Both spectra display similar peaks whose assignments can be found in table 1 and on the graphs. The most prominent are Na with a mass of 23 amu, Na(NaN3) with a mass of 88 amu, Na(NaOH) with a mass of 63 amu and oddly Na(NaCN) with a mass of 72 amu. Fig. 3: To support peak assignment the molecular jet was seeded with D2O. Top: sodium azide seeded with H2O. Bottom: sodium azide seeded with D2O. All the peaks associated with species containing hydrogen were shifted due to the substitution of hydrogen with deuterium. Compounds that do not contain hydrogen such as Na(NaCN) and Na(NaN3) are not shifted. Fig. 1: Experimental setup: A high power laser ablates the sample. The reactive products are cooled by an expanding super-sonic jet. Ablated material entrained in the jet is ionized by a second laser, accelerated, and continues in uniform motion in the drift tube. Finally the particles are detected by a standard Daly detector. Alternatively positively charged ablated material can be detected by pulsing the voltage on the plates. Fig. 6: To determine reaction mechanisms, chloroform was seeded in the helium jet. Strong peaks attributed to Na(NaCl)n appeared up to high masses (n>7). All the characteristic sodium azide peaks also remained. This shows that reactions do take place in the gas phase. The sodium chloride peaks split statistically according to the natural abundance of chloride isotopes, indicating a purely statistical mechanism of formation. Fig. 4: Identification of nitrogenin the ablated material was done by substituting sodium azide with sodium azide labeled by a single 15N isotope. Only the peaks at 72 amu and 88 amu were shifted, confirming that only these compounds contain nitrogen. The relative intensities of the split peaks allow us to speculate on the nitrogen content of those peaks. Fig. 5: Replacing sodium azide with cesium azide provides much in-sight into the chemistry of the ablation products. No peaks were shared by sodium azide and cesium azide (the first peak in cesium azide appears at 133 amu), indicating that all the peaks must contain an alkali atom. Not surprisingly, the clusters detected in cesium azide can be correlated to clusters detected in sodium azide. • Discussion • Most detected products can be assigned to clusters such as M(MX)n were M is an alkali metal and X is halogen or pseudo halogen1. The most probable assignments are given in table 1. • The presence of (MCN)n and (MOH)n clusters indicate that reactions do take place after ablation. • Carbon and water in the ablated species may be the result of occluded H2O and CO2 in the crystal2. • Seeding by CHCl3 demonstrates how clusters are formed. The intensity distribution of the clusters indicate a statistical mechanism of formation, as can be seen by table 2. • Comparison of cesium azide and sodium azide ablation products show that all the products contain an alkali metal. • Isotope substitution experiments imply that no nitrogen rich material is formed Conclusion HEDM were not detected by ablating alkali azide metals. Our experiments show that reactions do take place after ablation, however impurities have a significant effect on the end products. It is our intention to try and nullify the effect of such impurities in further experiments Acknowledgments This project was sponsored by the Israeli Ministry of Defense • Y. J. Twu, C. W. S. Conover, Y. A. Yang and L. A. Bloomfield, Phys. Rev. B, 42. 5306 (1990). • R. F. Walker, N. Gane and F. P. Bowden, Proc. Roy. Soc. A 294, 417 (1966).