Download
1 / 1
10 likes | 180 Vues
Katalin Réka Kovács 2 , Csilla-Celília Szekeres 2 , Zoltán Bajkó 2 , Krisztina Csapó 1 , Sándor Molnár 1 , László Oláh 1 , Mária Tünde Magyar 1 , Dániel Bereczki 3 , Renáta Laczik 4 , Pál Soltész 4 , László Kardos 5 , László Csiba 1.

E N D
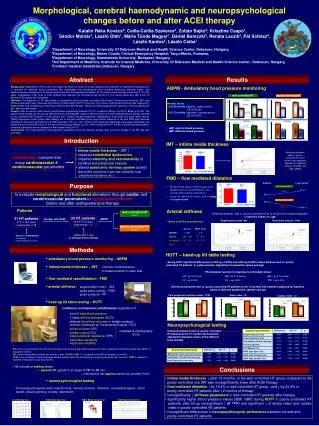
Katalin Réka Kovács2, Csilla-Celília Szekeres2, Zoltán Bajkó2, Krisztina Csapó1, Sándor Molnár1, László Oláh1, Mária Tünde Magyar1, Dániel Bereczki3, Renáta Laczik4, Pál Soltész4, László Kardos5, László Csiba1 1Department of Neurology, University Of Debrecen Medical and Health Science Center, Debrecen, Hungary,2Department of Neurology, Mures County Clinical Emergency Hospital, Targu-Mures, Romania,3Department of Neurology, Semmelweis University Budapest, Hungary, 43rd Department of Medicine, Institute for Internal Medicine, University Of Debrecen Medical and Health Science Center, Debrecen, Hungary, 5Contract medical statistician,Debrecen, Hungary Morphological, cerebral haemodynamic and neuropsychological changes before and after ACEI therapy Results Abstract ABPM - Ambulatory bood pressure monitoring Background: Hypertension (HT) is one of the major risk factors of stroke. The early diagnosis and treatment of impairments caused by HT is essential for effective stroke prevention. We investigated the morphological and functional alterations affecting cardio- and cerebrovascular parameters in HT patients before and after antihypertensive therapy. 41 HT patients were included (mean age: 47,5+/-8,4 years, male/female: 0,78), none of them suffered from diabetes. All HT patients had normal CT. The results before and after 6 and 12 months ACEI therapy were compared. Methods: The diagnosis of HT was based on ambulatory blood pressure monitoring. Blood tests, intima-media thickness (IMT) and stiffness parameters were measured. By head-up tilt table testing (HUTT) continuous non-invasive cerebral blood velocity was measured in bilateral MCA with simultaneous monitoring of beat-to-beat BP changes. Twelve neuropsychological tests (attention, memory, depression etc.) were also performed. Results: After six months ACEI therapy the BP values significantly reduced in 57,7% of patients (BPsys: p=0,0013, BPdia: p=0,018). The patients were divided into two groups (well and poorly controlled BP) based on BP monitoring. 6 months antihypertensive therapy resulted in non significant IMT reduction in both groups (6%). Vessel stiffness parameters (augmentation index [AIx] and pulse wave velocity [PWV)]) improved in both groups after therapy, but in the well controlled group more drastic reduction of AIx and PWV was observed compared to the poorly controlled group (PWV reduction 7,8% vs. 1,2%). During HUTT significant differences were observed between the baseline and 6 months BP values in the well controlled group (BPdia: p=0,01), while during the HUTT the BP of poorly controlled patients remained significantly worse compared to well treated ones (p=0,01). Conclusions: The improvement of hemodynamic parameters could be detected already after 6 months therapy if the BP was well controlled. well controlled HT poorly controlled HT Normal values<130/80 mmHg:daytime - active period: (06.00-22.00)<120/70 mmHg:nighttime - passive period: (22.00-06.00) Daytime Daytime 144.9±7.9 142.1±6.7 137.0±12.7 122.7±6.5 p=0.0032 91.2±5.8 90.4±6.2 84.5±9.9 75.3±6.1 p=0.0030 dBP dBP dBP dBP sBP sBP sBP sBP baseline after 1 year of therapy baseline after 1 year of therapy mmHg mmHg Nighttime Nighttime 123.4±17.5 122.6±9.9 124.5±10.9 109.1±8.8 • sBP: systolic blood pressure• dBP: diastolic blood pressure p=0.0161 73.2±12.5 74.2±7.2 75.9±7.1 64.4±6.6 p=0.0496 dBP dBP dBP dBP sBP sBP sBP sBP Introduction baseline after 1 year of therapy mmHg baseline after 1 year of therapy mmHg IMT – intima media thickness • intima media thickness– IMT↑ • impaired endothelial dysfunction • impaired elasticity and vasoreactivity of cerebraland peripheral vessels • alteredautonomic nervous systemactivity(baroreflex sensitivity,heart rate variability, totalperipheral resistance etc.) 0.65±0.11 difference between well vs. poorly controlled HT at 12 months into treatment adjusted for baseline values of the IMT and age: -0.031 0.62±0.11 hypertension compromise many cardiovascular&cerebrovascularparameters N=25 baseline after 1 year of ACEI therapy FMD – flow mediated dilatation baseline 1 year control Purpose 6.0±1.1 5.6±1.2 • the percentual change of the brachial artery diameter from rest to the diameter at 60 second after ischaemia cuff release • it may be reduced by factors such as aging and hypertension well controlled HT 5.1±1.7 18.4% ↑ to evaluate morphologicaland functional alterations through cardio- andcerebrovascular parameters in hypertensive patientsbefore and after antihypertensive therapy 4.3±1.0 % poorly controlled HT 7.8±1.9 N=25 baseline after 1 year of ACEI therapy % 23.0% ↓ 6.0±1.8 Patients Arterial stiffness well controlled HT N=13 Difference between well vs. poorly controlled HT at 12 months into treatment adjusted for baseline values and age 25 HT patients46.9±10.0 yearsmale/female: 1.5 41 HT patients47.5 ±8.4 yearsmale/female: 0.78 therapy with ACEI ABPM Augmentation index -AIx Pulse wave velocity - PWV Values of stiffness parameters poorly controlled HT N=12 -1.12 m/s -21.46 % control after 1 yearof antihypertensive therapy baseline examination - no diabetes- normal cerebral CT scan Methods HUTT – head-up tilt table testing •ambulatory blood pressure monitoring – ABPM • intima-media thickness – IMT:- common carotid arteries - 6 measurements on each side •flow mediated vasodilatation - FMD •arterial stiffness: - augmentation index - AIX - pulse wave velocity - PWV - pulse pressure - PP •head-up tilt table testing – HUTT • during HUTT significant differences in dBP (p= 0.0403) and mBP (p=0.0487) values between well vs. poorly controlled HT patients in supine position (adjustment for baseline values and age) Physiological reaction in response to orthostatic stress HR ↑ by 10-20 bpm sBP↓ by 0-10 mmHg dBP ↑ by 5-10 mmHg SV ↓ up to 35% CO ↓ up to 20% TPR ↑ up to 25% Differences between well vs. poorly controlled HT patients at the 12 months into treatment adjusted for baseline values of different parameters , gender and age Total peripheral resistance index - TPRI Sroke index - SI Cardiac index - CI 19.75% 28.08 % p=0.0131 p=0.0035 32.33 % 19.50 % 21.14 % 8.97 % continous, noninvasive, simultaneous registration of: - beat-to-beatblood pressure - 3 leads electrocardiogram (ECG) - bilateral blood flow velocitiesin middle cerebral arteries, measured by Transcranial Doppler (TCD) - stroke volumen (SV) - cardiac output (CO) - total peripheral resistance (TPR) - baroreflex sensitivity - heart rate variability supine supine tilt-up supine tilt-up tilt-up supine tilt-up tilt-up supine supine tilt-up well controlled HT poorly controlled HT well controlled HT poorly controlled HT well controlled HT poorly controlled HT Neuropsychological testing impedance cardiography(ICG) Difference between well vs. poorly controlled HT patients at the 12 months into treatment adjusted for baseline values of the different tests and age SV: amount of blood which the left ventricle ejects into the aorta with each heartbeat (ml). SI: is indexed to the Body Surface Area (BSA) of the patient (ml/m2).CO: the circulating blood volume per minute (L/min). CO:SV x HR. CI: is indexed to the BSA of a patient (L/min/m2).TPR: is the resistance of small and large vessels against which the left ventricle is pomping the blood (dyn*sec/cm5).TPRI is indexed to the BSA of the patient.(dyn*sec/cm5/m2). →10 minutes of restingphase → passive tilt upright to an angle of 70° for 10 min. → returned to the supine position for another 5 min. Conclusions • intima media thickness↓after 12 months;in the well controlled HT group compared to the poorly controlled one IMT was nonsignificantly lower after ACEI therapy • flow mediated dilatation↑ by 18.4% in well controlled HT group , and ↓ by 23.0% in • poorly controlled HT patients after 12 months of therapy • nonsignificanty↓stiffness parameters in well controlled HT patients after therapy • significantly higher blood pressure values (dBP, mBP) during HUTT in poorly controlled HT patients;after tilt-upnonsignificant ↑ of TPRIand significant ↓of stroke index and cardiac index in poorly controlled HT patients • nonsignificant differencies in neuropsychological perfomance between the well and • poorly controlled HT patients • neuropsychological testing - 12 neuropsychological tests: reaction time, memory function, attention, perceptual speed, motor speed, visual scanning, anxiety, depression WAIS Digit Span Test WAIS Block Design Test Trail Making Test WAIS Digit Symbol Test