Key Analytical Trends at the Silicon India BI Summit 2011: Insights and Actions
Explore the critical analytical themes presented by Derick Jose, VP at MindTree, during the Silicon India BI Summit in Hyderabad. Gain insights into twelve battle-tested themes distilled from real-life experiences, covering both emerging and advanced markets. Learn how data monetization, customer behavior analysis, and ensemble models can drive actionable insights. Discover specific calls to action in various contexts such as traffic optimization and customer sentiment analysis. This summit emphasizes practical, scenario-driven analysis to enhance decision-making.

Key Analytical Trends at the Silicon India BI Summit 2011: Insights and Actions
E N D
Presentation Transcript
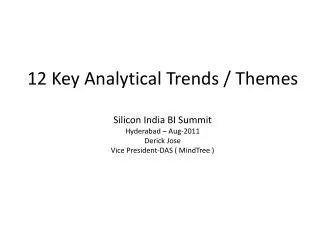
12 Key Analytical Trends / ThemesSilicon India BI SummitHyderabad – Aug-2011Derick JoseVice President-DAS ( MindTree )
Context • 12 Battle tested themes distilled from real life experiences • Not based on Forrester or Gartner • Spans Emerging markets + Advanced markets • Example + Specific call to action
Theme-1 : Information monetization GPS Publishing I have terabytes of consumer data . How can I create a new revenue stream ?
Real life example : GPS info product catalogue Travel behavior Segmentation Travel behavior Media asset placement and optimisation Demographic data GIS/Road data Cut thru data Travel Behavior Analysis Congestion Forecaster Village visitor data Highway traveler Government road/town planners Misc data Events data Understanding drivers of traffic Macro economic data Survey data Census data Retail / Mall planning
4 $ impacting actions from 3 info products • Action-1 : Traffic Signal optimization • Action-2 : Bill board setup • Action-3 : Catchment interception and new outlet store creation • Action-4 : Road creation/widening/ Policy changes to relieve congestion buildup SPECIFIC ACTION : Evolve SPECIALISTS to “curate” monetizable scenarios from data
Theme-2 : Analytics can solve problems customers never thought existed Are there patterns in data which can signal an issue which are not apparent to my naked eyes ?
Real life example : Channel Cannibalization Detector In emerging markets, did Modern trade cannibalize General trade during summer season for beverage drinks Analytical models can reveal if there is a systematic sales cannibalization pattern Cannibalization Outlet reccos Price sensitivity SPECIFIC ACTION : Don’t wait for customer problem statements. Prime latent demand
Theme-3 : Mining Digital Consumer Behavior Wom Link analysis as opposed to traditional web analytics Which are the most engaged actions a Digital consumer takes on the platform ?
Real life example : Understanding WOM behavior DAN VINAY FREE SAMPLE LINK NEW RAZOR LAUNCH ARTICLE MELANIE SCOTT HAIR CARE TIPS ARTICLE CONFIGURE UR OWN PRODUCT LINK LINK TO RESONATING DISCUSSION KRISHNAN FREE PERFUME SAMPLE LINK Driver Analysis/ Regression Discriminant Analysis / ANOVA BARGAIN COUPONS NUGENT GOOD REVIEW OF FACE WASH SANJOY RADHA FREE SAMPLE LINK ACTION : Think Digital Platform as a Lab where understand drivers of consumer intent
Theme-4 : Unstructured Data Mining • Call center • Inbound • Outbound • Blogs • Mails • RM notes What hidden patterns reside in unstructured data ?
Real life example : Sentiment analysis of opinions on www.yelp.com For this exercise MindTree sourced the postings from yelp.com Eopinions and Twitter have more entries on ABC Brand sentiments and can be mined subsequently No. of Positive sentiments is greater than No. of Negative sentiments (Based on Yelp.com) Indicates 8.03 posts are coming up per month at yelp.com. Further slope of buzz curve is +ve. More No. of posts entered (on yelp.com) for Compet Brand than for ABC Brand Ratio of ABC Brand sentiment index to McDonald sentiment Index is greater than 1, this implies consumers have better experience with ABC Brand as compared to Compet Brand Indicates 12.64 posts for Compet Brand are coming up per month at yelp.com. Further slope of buzz curve is +ve. ACTION : Consider mining unstructured data for insights in addition to structured data
Theme-5 : Examining value at the intersect Travel – Search & Booking Cpg – Online and offline behavior Retail – Sentiment and footfall What new questions can I ask at the intersection of online/offline behavior ?
Real Life Example : Search & Booking SEARCH DATA - Logged & Flushed BOOKING DATA + ACTION : Dig deeper at the intersect !
Theme-6 : Ensemble models How can we combine analytical models in innovative ways ?
Ensemble Model in Telecom Churn Prediction Models CDR data Billing data Behavorial Segmentation Social Network analysis Cluster-2 High credit risk Cluster-1 Low credit risk Maven list Customer = “Joe Henry”, Customer = “A Sampath Customer = “Scott Nugent”, Customer = “V Komrala • Inbound calls • Activations • Inquiries • Service calls Text mining keywords Regression model Neural networks • Outbound calls • Collection calls • Campaign calls ACTION : Combine Segmentation + text mining + Scoring Models + Social media analysis Customer = “Scott Nugent”, churn score = 1 Customer = “V Komrala”, churn score =0 Customer = “Joe Henry”, churn score = 0 Customer = “A Sampath”, churn score =1
Theme-7 : Verticalized Data Model Frameworks • ARTS -Retail • ACCORD -Insurance • SCOR -Supply Chain • CDISC -Clinical Trials • CMAT – Customer Analytics Which prefabricated industry specific data models and analytical processes can I use to jumpstart my solution ?
Real life example : ACCORD based Claims model for a leading US based Insurance provider ACTION : Which industries and sub processes do I need to build knowledge in Vertical specific standards ?
Theme-8 : Analytics penetrating unconventional areas Telemedicine + Student scoring models
Real life example : Location based intelligent alerts Here when the district health care officer clicks on location the most statistically significant patterns from t/chi / regression test will be filtered and shown ACTION : Which non traditional, data rich processes can we apply analytics in to unlock value?
Theme-9 : Need varied ways to triangulate predictors & hypothesis What are the various means to unearth causal levers which influence a business outcome ?
4 important learning's in surfacing predictors and behavioral hypothesis + STATISTICS = FORCE MULTIPLIER HUNCHES • Informed Market “Intuition's + Analytics = Force multiplier • Intuitions are NOT bad ! Its not “either or” …”And” mindset • 6 ways to get “informed hunches” regarding what potentially caused a business outcome • Triangulate !
Real Life Example : Triangulating Surfacing policy renewal predictors • Recency of a claims denial • Tenure of agent • Overall experience of agent ( total experience ) • Automated deduction or cash/cheque based ( payment mode ) • No of unanswered call center calls in last 8 weeks • Frequency of outbound triggers for renewal • Recency of phone bound renewal trigger • % Change in renewal commissions to the agent ( driven by policy ) • 3 month ratio of inbound calls to outbound calls • Range of channels for interaction – Agent / Internet / Mobile / call center • Outbound watch list : Frequency of occurrence of specific keywords in outbound call interaction • Inbound watch list : Frequency of occurrence of specific keywords in inbound call interaction • Recency of last payment • Policy attributes : Type of policyholder/location / type of coverage/Policy cost / Sum assured / Issue age / Policy tenure / • Range of products covered ACTION : Consider spending a “immersive day in life of session” to surface real world predictors
Theme-10 : Increase in demand for “data driven story tellers” • Wired for narratives • Package data patterns in narrative format • Ability to connect the dots • From Presenting Insights to presenting ‘data driven’ stories • Right brained + left brained How can I maximize the impact of data patterns to business users ?
The “T” shaped Analytics Individual Breadth of Knowledge Depth of Expertise
Right brained and left brained analytics professional Frame issues- creative Blue print – left brained Interpretation - creative ACTION : Have the right cross functional team for an analytical project
2 real world examples of reverse innovation Fraud : Open source Telemedicine : Mobile analytics ACTION : Identify opportunities at the intersection of open source and industry sub processes
Telemedicine – Doctor Side Application Tabs to view - Case sheet, initiate VC, etc Patient Case Sheet, Review records Patient Vital Statistics Option to view ECG – Offline/Live
Telemedicine – Doctor Side Live ECG and VC. ECG viewer Integrated into application Patient Side Video PIP Option – Doctor side Video
Telemedicine analytics framework 1 2 3 4 5 • PATIENT DIAGNOSIS REPOSITORY • Pulse/Height/Weight • Temperature/Heart rate • BP/ ECG / SpO2 • - Diagnostics Rural patient data capture Satellite transmission Data reception Patient repository Remote Diagnostics 6 Info syndication biz model 8 Doctors observations text miner 11 9 13 Insurance Pharmaceutical Diagnostic text mining 12 10 7 Diagnostic scanner ( chi square / t tester ) Central early warning control center unit Govt Hospitals Field health officer Secure hosting platform for Rural Patient Diagnostics data 14 Diagnostic scanning process
Theme-12 : Feel good insights vs. the one Transformativeinsight !
3 Real world examples of Transformative insights • Outlet analytics : Outlet recommendations resulting in crores of ruppees of additional revenue • People scoring model : Person who did last interview and TAT were more important predictors than salary • Uplift modeling : Sister brand cannibalization
Summary of 12 key analytical trends & themes • Industry specific data models – ARTS/SCOR/ACCORD • Analytics penetrates unconventional industries and processes – Health care, Education • Skills to triangulate predictors • Data narrative story telling & “T” shaped individuals will • Reverse Innovation in Analytics – “ • Need for transformative analytics vs “feel good” analytics • Information Monetization • Solving problems customers never thought existed • Handling unstructured information • Digital consumer behavior analytics • Value at the intersect - Multi Channel – Online offline • Ensemble models : Segmentation + text mining
Big Data will explode & Distilling significant few patterns is key
Oil refineries & “Data” refineries • Oil fuelled the industrial revolution . Data will fuel the services revolution • Raw or unprocessed crude oil is not generally useful. Raw or unprocessed data is also not useful • Companies like Google and face book are building large “data refineries” to distill consumer insights
Analytics is going to be an interesting ride for next 5 years !Key is to Enjoythe journey !!!