Download
1 / 43
430 likes | 604 Vues
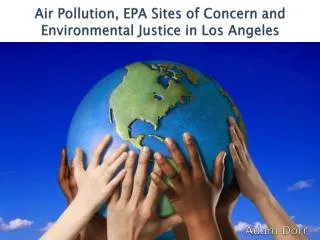
Air Pollution, EPA Sites of Concern and Environmental Justice in Los Angeles. Adam Dorr. Project Goals. Part 1 Use pollution data to identify high-risk ( “hotspot”) areas Use demographic data to identify vulnerable environmental justice communities

E N D
Air Pollution, EPA Sites of Concern and Environmental Justice in Los Angeles Adam Dorr
Project Goals • Part 1 • Use pollution data to identify high-risk (“hotspot”) areas • Use demographic data to identify vulnerable environmental justice communities • Identify most vulnerable schools for investment in indoor air quality improvement • Part 2 • Build regression model to test predictive value of demographic variables on pollution
Sources and Methods • EPA National Air Toxics Assessment (NATA) 2002 data: • Cancer Risk • Neurological Risk • Respiratory Risk • Standardized Scales (0-1) • Combined NATA Index (0-1) • Distance Measures for EPA Sites Index • Composite Environmental Risk Index (0-3.5) • Regression Models
Sources and Methods • American Community Survey 5-Year Estimates 2005-2009 (US Census Bureau via Social Explorer) • Based on Massachusetts State Law and Atlanta City Code definitions of Environmental Justice Community: • 65% or more below median income (assumed: county) • 25% or more minority (assumed: ALL not “white alone”) • 25% or more foreign born • 25% or more under age 10 • 25% or more age 65 or older • Community Vulnerability Scale (0-5)
Sources and Methods • ESRI/Microsoft: • California state boundary map • Los Angeles County census tracts boundary map • Shaded relief basemap • Major highways basemap • UCLA Mapshare: • Airports • Water bodies • Google Earth • 3D Imagery
Project Review • Summary of earlier findings
Combined NATA Risk Index • ESRI/Microsoft: • California state boundary map • Los Angeles County census tracts boundary map • Shaded relief basemap • Major highways basemap • UCLA Mapshare: • Airports • Water bodies
Part 1: EPA Sites of Concern Analysis • Rasterization • Distance measures • Buffers and dissolves • Clipping
Hotspot Analysis • Schools in Downtown Los Angeles high-pollution-risk census tracts
Downtown Los Angeles 3D Imagery (Google Earth) Source: Census 2000
Downtown Los Angeles 3D Imagery (Google Earth) (some schools not shown)
Policy Recommendations • Improve Indoor Air Quality!
Policy Recommendations • Improved HVAC Air Filtration • Low VOC paints and cleaning agents • Reduced pesticide application • Bioremediation
Policy Recommendations • Improved HVAC Air Filtration • Low VOC paints and cleaning agents • Reduced pesticide application • Bioremediation
Policy Recommendations • Improved HVAC Air Filtration • Low VOC paints and cleaning agents • Reduced pesticide application • Bioremediation
Policy Recommendations • Improved HVAC Air Filtration • Low VOC paints and cleaning agents • Reduced pesticide application • Bioremediation
Part 2: Regression Models • Race as a predictor of hazardous waste sites • Does apply to air toxics as well?
GIS Skills Used • Inset map • Color graduated symbology • Aggregating attribute fields (standardized scales and composite scores) • Creating Indices (EJ-Risk Combined Index using field calculators) • Geoprocessing (clipping, multiple layers, to create multi-layer layouts) • Buffering and dissolve (EPA sites of concern 500m buffer, highways 500m buffer) • Rasterization (using model) • Distance measure, analysis and original data (EPA sites combined with NATA data and Census demographics for composite index, using field geometry, proximity counting, Euclidian distance, etc…) • Hotspot analysis of Downtown Los Angeles • Attribute subsets selections (selected Los Angeles County EPA sites of concern from nationwide dataset) • Geocoding (EPA sites addresses) • Metadata (see slide) • Modeling (see slide) • Policy question (which schools are at high pollution risk?) and recommendations (investment in indoor air quality improvement) • 3D modeling (using overlays in Google Earth)