1014
1014. Workplace deaths recorded in Canada in 2010 Nearly 3 per day *Fatalities accepted in 2010 according to "Number of Fatalities, by Jurisdiction 1993-2010" summary table, statistics from the Association of Workers Compensation Boards of Canada. 352

1014
E N D
Presentation Transcript
1014 • Workplace deaths recorded in Canada in 2010 • Nearly 3 per day • *Fatalities accepted in 2010 according to "Number of Fatalities, by Jurisdiction 1993-2010" summary table, statistics from the Association of Workers Compensation Boards of Canada
352 Number of companies issued penalties for safety infractions by worksafe bc in 2011 $4,800,000 Total amount of fines in 2011 $250,000 The largest fine issued to one company
Bill C-45 • Bill C-45 is federal legislation that amended the Canadian Criminal Code and became law on March 31, 2004. The Bill established new legal duties for workplace health and safety, and imposed serious penalties for violations that result in injuries or death. The Bill provided new rules for attributing criminal liability to organizations, including corporations, their representatives and those who direct the work of others.
Bill C-45, also known as the "Westray Bill", was created as a result of the 1992 Westray coal mining disaster in Nova Scotia where 26 miners were killed after methane gas ignited causing an explosion. Despite serious safety concerns raised by employees, union officials and government inspectors at the time, the company instituted few changes. Eventually, the disaster occurred. • After the accident the police and provincial government failed to secure a conviction against the company or three of its managers. A Royal Commission of Inquiry was established to investigate the disaster. In 1998, the Royal Commission made 74 recommendations. The findings of this commission (in particular recommendation 73) were the movement that led to Bill C-45.
Has anyone been charged? • Yes. To date there have been four cases where charges have been laid, though, only one case resulted in a conviction. Of the others, two are still before the courts and one case was dropped.
Is safety one of your values? We are an inspired, diverse team. We respect and value everyone's contribution. The health and safety of our people are paramount.
Workplace Safety Programs and TrainingThe Company aims to minimize risks and associated costs by providing quality and professional technical services that foster the safest environment possible for guests, cast members, and property. The Company provides a team of training and development staff that focuses on training employees in the areas of health, safety, and environmental issues. These programs achieve not only compliance with regulatory requirements, but also create a culture that places the highest value on the prevention of injury and illness.
Values • Safety • We will ensure and improve the safety and security of our employees, customers and assets. • Customer Service • We will work with our customers to meet and exceed their needs and expectations. • Sustainability • We will measure, improve, and be accountable for our environmental, financial and social results. • Integrity • As stewards of public resources, we will use our assets prudently and be honest, professional, and respectful in our communications and conduct. • Innovation • We will develop new opportunities and ways of doing business, and will work to continuously improve the value and quality of our services. • Collaboration • We will cultivate strong partnerships, recognize communities' complex needs, and create services and opportunities that promote healthy communities and enable choice and connection with other types of travel.
What is a safety management system? • Safety management systems (SMS) help companies identify safety risks before they become bigger problems.
Step one • Buy in, safety starts at the top • 2-20,000 SSMS is for every company Don’t just talk the talk Walk the Walk
Step 3 Communication Tool box talks Lunch and learns Committee meetings Publish stats
What’s in it for me? • Reduced insurance rates • COR rebate • Happier workforce • Increased production • Better communication
Cost of doing nothing • 1014 • 256 • $4,800,000 • C-45 • $250,000
Why would you not do it ? • Return on investment • COR, insurance rates, safe workplace • Better communication • engaged workforce, early intervention, quash rumors • We all value safety Walk the talk
There is no making deals when it comes to safety
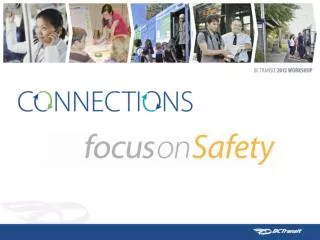
WorkSafeBC Classification, Rate Setting and 2012 Base Premium Rates:Bus Lines and BC Transit February 2012
Overview of the 2012 rates 2008 – 2012 rates for bus lines Overview of the classification & rate setting system 2012 rate details for bus lines Future rate projections BC Transit Topics 26
The average base rate will remain at $1.54 in 2012, down from the 2008, 2009 and 2010 rate of $1.56 per $100 of employers’ assessable payroll. 39 percent of employers will experience a base rate increase 53 percent of employers will experience a base rate decrease 8 percent of employers will have their base rate remain unchanged Overview of 2012 Rates 27
The 2012 benefit target cost rate has decreased 5.9% from the 2011 to 2012 rates The injury rate had a significant 20.9% drop in 2009 (in part due to the decline in the workforce of high risk industries) and a further 2.6% drop in 2010. Smoothed investment income returns in 2010 of 4.8% (9.8% on a market basis) were below the actuarial requirements of 5.4%. The change in financial position from a $758 million surplus in 2009 to a $435 million surplus in 2010 to a projected $8 million deficit by the end of 2011 Modest rate increases are projected through 2015 The key rate drivers for 2012 28
Busline Base Rates 2008 - 2013 Bus Line’s base rate increase was limited to 8% in 2010, and 20% in 2011 and 2012 with a likely increase in 2013. 29
Classification & Rate Setting The Board has adopted a modified collective liability system, under which self-sufficient groups of employers are created on the basis of similar cost rates. These groups must be large enough to provide for an adequate spread of the risk and stability in the assessment rate. The costs of compensable injuries and diseases, along with the costs of administering claims and carrying out other statutory requirements, are collected from employers in the form of assessments. For this purpose, employers are classified into classification units, industry groups and rate groups. The costs incurred in relation to these groups determine the assessment rate paid by their members. The Board creates groups that are large enough to provide for an adequate spread of the risk and stability in the assessment rate. 30
Rate Group Industry Group Sector Subsector Classification Unit British Columbia’s aggregate economic undertaking Employer Classification System Assessments paid by employers ACCIDENT FUND Aggregation Granulation 31 31
Rate Group Formation (step 1 CUs) There are approximately 600 Classification Units (CUs) in the system. 761042 Sports Instruction School To ensure fair and equitable rates, similar CUs are grouped together to form industry groups. Industry Groups have enough credibility to allow WorkSafeBC to track historical cost rate trends. 32
Rate Group Formation (step 2 Industry Groups) There are approximately 250 Industry Groups made up of similar CUs. Each IG has a minimum of 200 wage loss claims over the past 5 years IGs sharing similar cost rates are combined to form Rate Groups. 33
DH01 $1.60 Bus Line Rate Group DH Bus Lines represent 95% of the 5-year payroll and claim costs. With 2010 payroll of $45 million, BC Transit represents 7% of the rate groups total payroll of $640 million. 35
DH Costs and Bus Line Rates Bus Lines Although the benefit cost rate is flat, DH’s actuarial rate up slightly due to larger rate group deficit. A deficit of $11 million was built into the 2011 rates. For 2012 rates the projected deficit has grown to $16 million mostly due to lower than required premium being collected in 2010… 36
In 2010 the base rate was reduced by $0.73 to transition the industry to its required rate. When applied to the $640 million payroll, this transition measure produced a $4.7 million loss in 2010.