Download
1 / 11
110 likes | 117 Vues
Gender Statistics in Georgia. Lia Charekishvili Head of Social Infrastructure Statistics Sub-Division, Responsible for Gender Statistics. National Statistics Office of Georgia. Gender Equality in Georgia.

E N D
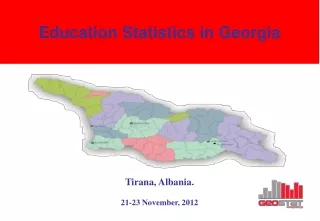
Gender Statistics in Georgia Lia Charekishvili Head of Social Infrastructure Statistics Sub-Division, Responsible for Gender Statistics National Statistics Office of Georgia
Gender Equality in Georgia Certain institutional and legal steps have been taken in Georgia towards achievement of greater gender equality. • Establishment of Advisory Council on Gender Equality Issues at the Speaker of the Parliament in December 2004; • Establishment of Governmental Commission for Gender Equality Issues in September 2007; 2
Gender Equality in Georgia • In fall 1994 Georgia ratified CEDAW without reservations; • Georgia submitted Initial Report to CEDAW in 1998 (instead of 1995) and 2nd and 3rd Periodic Reports in 2003 (Govt. and Shadow reports); • Adoption of State Concept of Gender Equality in 2006; • Adoption of anti-trafficking and domestic violence laws in 2006; • Elaboration of Gender Equality Law, that passed the first hearing in the Parliament in Fall 2009. 3
Gender Statistics in Georgia I would like to inform you that Georgia was actively involved in presentation of the data for UNECE Gender Statistics Website for Europe and North America in 2002, 2007 and 2009 years.
Women in Political Decision-Making Women MPs – 4% Women in local self-governance – 11% Women in the Cabinet – 0 out of 18 (0%) Women in judiciary 49% Gender Empowerment Measure – 79 out of 93 countries (HDR 2007-2008)
Horizontal and Vertical Gender Segregation • The majority of women are employed in the low-paying fields of agriculture, education, healthcare and light industry; • Average nominal monthly salary of women is 54 % of that of men (2008 data) • 85% of self-employed women and 74% of self-employed men work in the field of agriculture • Women constitute 83% of education sector workers and 85% of healthcare workers • Few women own small businesses (Source: Department of Statistics, Women and Men in Georgia, 2008)
Horizontal and Vertical Gender Segregation Source: Department of Statistics, Georgia