Download
1 / 16
160 likes | 312 Vues
Institutional Advancement Report to the Board of Regents. Donald G. Rizzo. September 29, 2006. 53315. The 2005-2006 focus in Advancement: Capacity building. Capacity is influenced by four major factors: Disciplined, dedicated, well supported staff. Engaged and influential leadership.

E N D
Institutional Advancement Report to the Board of Regents Donald G. Rizzo September 29, 2006 53315
The 2005-2006 focus in Advancement:Capacity building • Capacity is influenced by four major factors: • Disciplined, dedicated, well supported staff. • Engaged and influential leadership. • A capable donor constituency. • A compelling case for support. The Advancement Office has worked on all four factors this past year. Special emphasis on the Staff and Leadership.
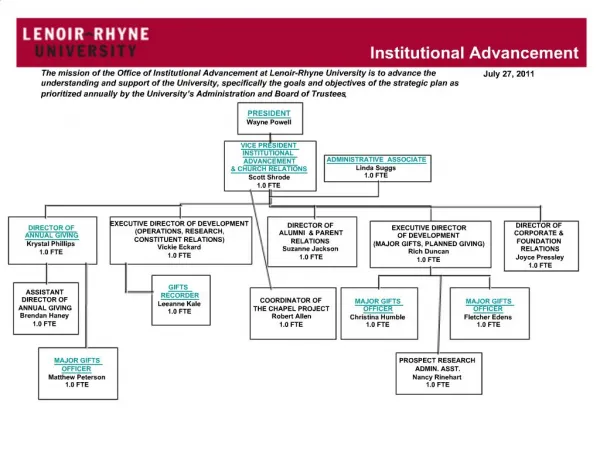
2005-2006 was a year for significant staff turnover: • Seven major gifts officers are new (less than 18 months tenure) including planned giving. • One of the two annual giving officers is new. • The Director of Advancement Services is new. • The Director of Alumni Relations is new. • The Executive Director of Development is new. • The Director of Institutional Partnerships and Sponsored Research is new: • Both Assistant Directors of Institutional Partnerships are new. • The Government and Private Grants offices were merged.
Activity levels, a key indicator, are rising rapidly at the University. • The trend is decisively positive (yellow line equals linear regression of 2006) • Activity grew by 57% (587 calls to 961 calls) • Performance is somewhat uneven. • Oct and Feb were banner months. • April and June were weak months. • View this as an opportunity. There is room to continue to grow as staff come up to speed. • Total contacts grew by 109%. (1166 to 2433).
Giving to the University of Hartford:Focus on process raised more money. • Activity levels (process) increased by a factor of 57% last year. • Gifts and pledges (product) increased by 20.4%. • The question: How can we bring production up alongside process? • Part of this is the lag time implicit in cultivation. • Part of this is to upgrade the quality of the activity. • Part of this is leadership and case. $11,236,947 $13,532,668 $10,584,266
Planned Giving expectancies at the University of Hartford. (Illustrated in five-year cash flow segments. Data based upon documented commitments.)
Significant FY 2006 facts: • Cash gifts increased by 26% ($7.6 million in 2005 - $9.6 million in 2006) • Faculty and Staff gifts grew by 17% 379 donors gave $198,248 • Unrestricted gifts totaled $760,694 The goal for 2006 was $1 million • The Campaign of Commitment reached $136.7 million in FY 2006
Significant FY2006 facts: (cont.) University of Hartford Alumni participation: • Basic participation rates. The basic rate increased to 8.1% (vs. 7.0% for FY'05) 700 more alumni donors joined in support last year. • Alumni participation for alumni living in Connecticut grew to 9.6% • Participation for Greater Hartford rose to 10.16%
The Silos are coming down: • In previous years, Major Gifts Officers were assigned to schools and focused exclusively on school projects and prospects. • Gift Officers now manage School Advisory Committees, but… • They work with ALL the Deans. • They work with Prospects across the University. • They collaborate on ALL campaign projects.
Fundraising Expenses:Process improvements increased costs. • Total expenses grew from FY’05 to FY’06 by $181,681. • Operations costs (supplies, entertainment, etc.) were reduced. • Investments in people (salaries) were increased correspondingly. • Compensation levels were increased to market-competitive levels Operations Salaries
Expense to revenue:Increased revenues grew much faster than costs. • Fundraising expenses grew by 5.7%. • Fundraising revenues increase by 20.4% • The cost-per-$ over the year declined by 3.4¢
The Focus on Leadership: • Refocusing and expanding the Regents’ Campaign Steering Committee: • Defined prospect assignments. • Assigned relationships with professional staff. • New reporting process. • Deans’ Advisory Committees: • Professional staff partnerships assigned. • Skill development provided to the Deans and staff. • New process for Committee management added.
The Focus on Leadership: • Alumni Board of Directors reorganized: • Summer strategic planning retreat. • Term limits put in place. • New committee structure in place. • New comprehensive programming: • On-line Community • Anchor Awards
0% 20% 40% 60% 80% 79% Desire to create value; make an impact, do something with lasting meaning. 69% Responsibility to share good fortune and build a better, more livable community. 63% To meet community’s critical needs and improve the world. 50% Give back; help organization that has benefited you or a friend. 46% Set example for children. 29% Fill gaps left by government cutbacks. 11% Tax benefits. 4% Respect and recognition. 2% Pressure from acquaintances. Why do major donors give? Source: U.S. Trust Survey of Affluent Americans; November 1998
Questions? • On behalf of the hard working staff in Institutional Advancement, thank you for your support!