Download
1 / 33
330 likes | 794 Vues
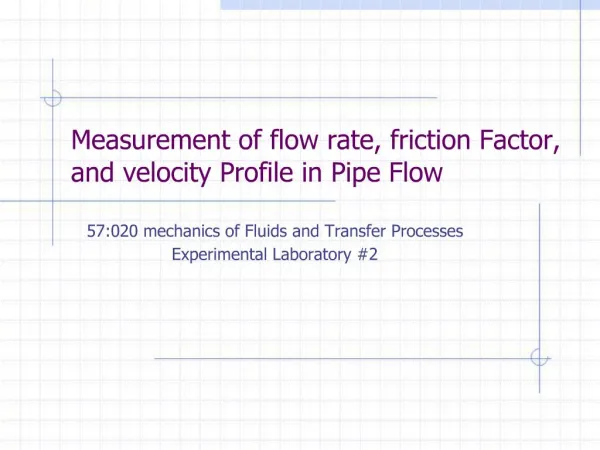
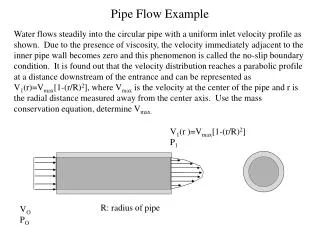
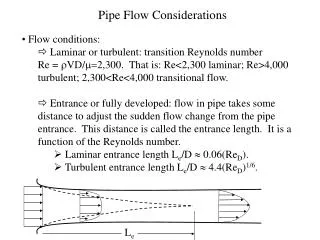
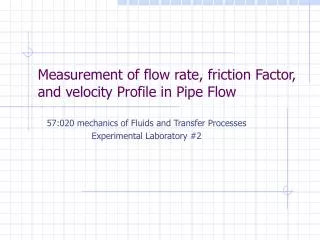
Measurement of flow rate, velocity profile and friction factor in Pipe Flow. S. Ghosh, M. Muste, M. Marquardt, F. Stern. Overview. Purpose Experimental design Experimental Process Test Set-up Data acquisition Data reduction Uncertainty analysis Data analysis. Purpose.

E N D
Measurement of flow rate, velocity profile and friction factor in Pipe Flow S. Ghosh, M. Muste, M. Marquardt, F. Stern
Overview • Purpose • Experimental design • Experimental Process • Test Set-up • Data acquisition • Data reduction • Uncertainty analysis • Data analysis
Purpose • Provide hands-on experience with pipe stand facility and modern measurement systems including pressure transducers, pitot probes and computer data acquisition and data reduction. • Comparison between automated and manual data acquisition systems. • Measure flow rate, velocity profiles and friction factor in smooth and rough pipes. • Determine experimental uncertainties. • Compare results with benchmark data
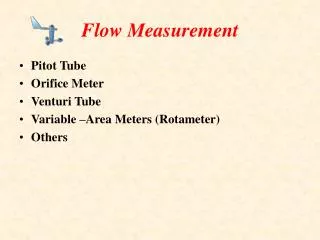
Experimental Design The facility consists of: • Closed pipe network • Fan • Reservoir Instrumentation: • 3 Venturi meters • Simple water Manometer • Differential Water manometer • Pitot Probe • Digital Micrometer (Accurate radial positioning) • Pressure transducer • Computer based Automated Data Acquisition System (DA)
Venturimeter Pitot-tube housing Test Set-up: Venturi meter and Pitot-tube housing
Test set-up: Instrumentation The equipment used in the experiment includes: • Digital thermometer with a range of – 40 to 450 F and a smallest reading of 0.1 F for measurement of the environment temperature. • Digital micrometer with least significant digit 0.01 mm for positioning the Pitot-tube inside the pipe. • Simple water manometer with a range of 2.5 ft and a least scale division of 0.001 ft for measurement of the head at each pressure tap along the pipes and for measurement of velocities using the Pitot-tube arrangement . • Differential water manometer with a range 3 ft and a least scale division of 0.001ft for measurement of the head drop across the Venturi meters. • Pressure transducer calibrated with ft of water
Data acquisition • The procedures for data acquisition and reduction are described as follow: • Use the appropriate Venturi meter, (2” contraction diameter) to measure the total discharge. Increase blower setting from 15% to 35% with 5% increments and measure flow rate using both manometer and pressure transducer. • Take reading for ambient air (manometer water) and pipe air temperatures. • To obtain velocity data, use the Pitot-tube box to measure the ambient head and stagnation heads across the pipe. Measure the stagnation heads at radial intervals. The recommended radial spacing for one half of the diameter is 0, 5, 10, 15, 20, 23, and 24 mm. • Maintaining the discharge at 35%, measure the head along the pipe by means of the ADAS the pressure heads at pressure taps 1, 2, 3, and4 • Repeat step 2
Automated Data Acquisition System (a) (b) Layout of the data acquisition systems: a) photo; b) schematic
Front panel on Data Acquisition program Introduction to ADAS Software - Labview
For the flow rate and friction factor, the individual measurements are performed for: Ambient air temperature Pipe air temperature Pipe pressure head Venturi meter pressure head drop The experimental Results are: Manometer water density Air density Kinematic viscosity Flow rate Reynolds number Friction factor Data reduction equations are: Data reduction
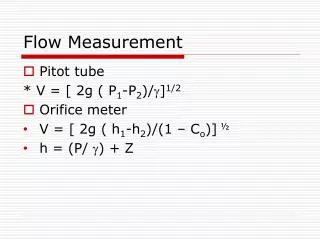
Data reduction equations: Flow rate Volumetric flow rate Equation (1), lab handout
Equation 2 is a form of Darcy Weisbach equation in terms of flow rate Q and pressure drop where, and A is the pipe cross sectional area. Friction factor (contd.)
Equation 3, Exercise notes Velocity profile
Block diagram of the experimental determination of the Friction factor Block diagram of the Velocity measurement Uncertainty analysis
Uncertainty Analysis • The data reduction equation for the friction factor is: However here we will only consider bias limits for ZSM i and ZSM j . The total uncertainty for the friction is: The Bias Limit, Bf and the precision limit, Pf, for the result are given by:
Uncertainty Analysis (continue) • Data Reduction equation for the velocity profile is as follow:
Data Analysis: Results and discussions Moody Chart for pipe friction with smooth and rough walls Low speed = 44 m/s Smooth Pipe (2”) low speed Rough Pipe (2”) low speed 07/10/03 Benchmark data for Friction Factor
r/R u/umax 0.0000 1.0000 0.1000 0.9950 0.2000 0.9850 0.3000 0.9750 0.4000 0.9600 0.5000 0.9350 0.6000 0.9000 0.7000 0.8650 0.8000 0.8150 0.9000 0.7400 0.9625 0.6500 0.9820 0.5850 1.0000 0.4300 Data Analysis: Results and discussions (contd.) Low speed = 44 m/s High speed = 62 m/s Benchmark data for velocity profile (Schlichting, 1968)
PIV-Particle Image Velocimetry • PIV Process • Inject flow with Particles • Illuminate particles with Light • Take snapshots of the particles with a Camera • Process Images with Software • PIV Equipment • Particles : Very small, neutrally buoyant, and “reflective”. • Light: Generated using lasers, LEDS,… and formed into a thin sheet of light • Camera: Digital camera capable of taking images at a fast rate • Images: Show movement of particles with stark contrast • Software: Analyzes patterns of particles, now pixels, and tracks there displacement
PIV-continued • PIV Fundamentals-abridged • -PIV measures whole velocity fields by taking two images shortly after each other and calculating the distance individual particles travelled within this time. From the known time difference and the measured displacement, the velocity can be calculated • Benefits of PIV • -Pitot tube, thermal anemometers, laser Doppler velocimetry,…only measure velocity at points of the flow→PIV measures entire cross section or volume of flow
PIV-Continued • PIV Fundamentals-fine details • Two camera images are divided in to similar small tiles, called interrogation windows. • A pattern of particles is detected in the interrogation window • The predominant movement of the pattern from the first image to the second is measured • The displacement of the pattern from the first to the second image is measured in pixel dimensions • The spatial dimensions of the image are correlated to the pixel dimensions • The spatial displacement divided by the time interval of images →velocity
PIV-Continued • PIV uses for Lab 2 • Apply the continuity equation to flow field measurements • Calculate flow rate across a varying cross section orifice • PIV steps for Lab 2 • Take at least two images of the flow • Analyze the images • Extract the raw velocity field measurements • Sample velocity data from two transverse cross sections of the flow • Extract the mean stream wise velocity components from each cross section • Multiply the mean velocity by cross sectional area to find flow rate
PIV-Continued • PIV equations • Stream wise velocity component • Average flow rate