Download
1 / 27
280 likes | 422 Vues
S. Eriksson 1 , M. Oieroset 2 , D. N. Baker 1 , C. Mouikis 3 , M. W. Dunlop 4 , H. Reme 5 , R. E. Ergun 1 , and A. Balogh 6 1 Laboratory for Atmospheric and Space Physics, University of Colorado at Boulder, USA 2 Space Sciences Laboratory, University of California at Berkeley, USA

E N D
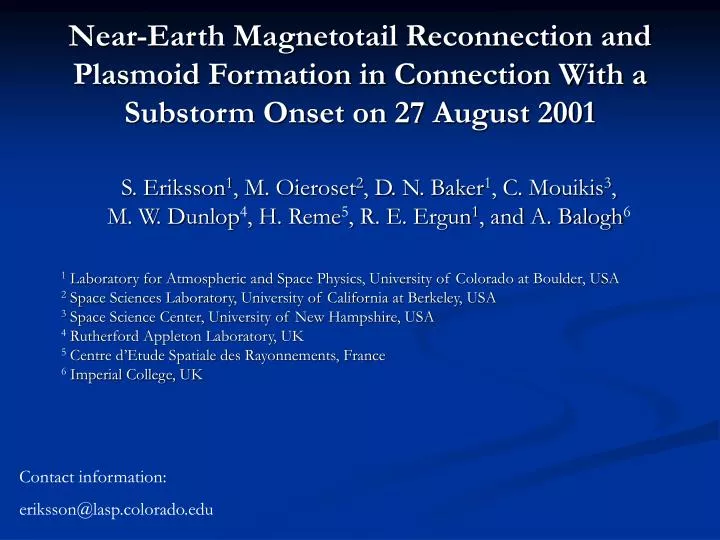
S. Eriksson1, M. Oieroset2, D. N. Baker1, C. Mouikis3, M. W. Dunlop4, H. Reme5, R. E. Ergun1, and A. Balogh6 1 Laboratory for Atmospheric and Space Physics, University of Colorado at Boulder, USA 2 Space Sciences Laboratory, University of California at Berkeley, USA 3 Space Science Center, University of New Hampshire, USA 4 Rutherford Appleton Laboratory, UK 5 Centre d’Etude Spatiale des Rayonnements, France 6 Imperial College, UK Near-Earth Magnetotail Reconnection and Plasmoid Formation in Connection With a Substorm Onset on 27 August 2001 Contact information: eriksson@lasp.colorado.edu
Outline • Introduction • Tail reconnection and slow-mode shocks • deHoffmann-Teller and Walen analyses • Cluster observations and Walen analyses August 27 2001 from 03:50 UT to 04:35 UT (post-midnight event) • Summary
Tail Reconnection and Slow-mode Shocks [Feldman et al., JGR, 92, 83, 1987] [Hill, T.W., JGR, 80, 4689, 1975] • Acceleration in tail reconnection is assumed to take place across a slow-mode shock connected to the diffusion region. Configuration essentially that of Petschek [1964] (above right).
Tail Reconnection and Slow-mode Shocks [Feldman et al., JGR, 92, 83, 1987] [Hill, T.W., JGR, 80, 4689, 1975] • Slow-mode shocks are defined in ideal MHD by an increased plasma pressure and a decreased B-field strength where the B-field bends toward the shock normal.
Tail Reconnection and Slow-mode Shocks [Feldman et al., JGR, 92, 83, 1987] [Hill, T.W., JGR, 80, 4689, 1975] • Slow-mode shocks were first observed in the tail by e.g. Feldman et al. [1984, 1987] using the Rankine-Hugoniot jump conditions. Also suggested by Oieroset et al. [2000] who successfully used the Walen analysis on Wind data 60 Re downtail.
deHoffmann-Teller Analysis [Khrabrov and Sonnerup, ISSI Sci.rep., 1998] • The existence of an HT frame indicates the presence of a quasi-stationary coherent pattern of magnetic field and plasma velocity. The HT interval should include data points on either side of the boundary.
deHoffmann-Teller Analysis [Khrabrov and Sonnerup, ISSI Sci.rep., 1998] • A Galilean HT frame transformation allows for the identification and analysis of such coherent structures (e.g. slow-mode shocks) moving past an observing platform.
Walen Analysis as a Test of Reconnection (Not a slow shock since B does not bend toward normal) • Reconnection predicts that the generated “rotational discontinuity” (finite normal B-field component) propagates away from the diffusion region at a field-aligned phase speed in the HT shock frame and its magnitude is determined by the type and strength of the shock.
Walen Analysis as a Test of Reconnection (Not a slow shock since B does not bend toward normal) • The sign of the Walen slope depends on whether the B-field is parallel or antiparallel to the flow direction.
Walen Analysis in the Magnetotail Walen slope Oieroset et al., JGR, 105, 25,247, 2000. • Region I: earthward jet, Bx>0, RW<0 • Region II: tailward jet, Bx>0, RW>0
Walen Analyses at Wind (x= -60 Re) Oieroset et al., JGR, 105, 25,247, 2000. • Earthward jet interval • Negative Bx • Walen slope should be positive Note that there is no ion composition in the Wind data set and that these slopes were derived assuming 100% H+.
Cluster Observations on August 27 2001 Density (CODIF) Plasma b (CODIF) A B C Ion speed (HIA) [Vx, Vy, Vz] [Bx, By, Bz] Magnetic field magnitude Alfven Mach number Note: MA<1
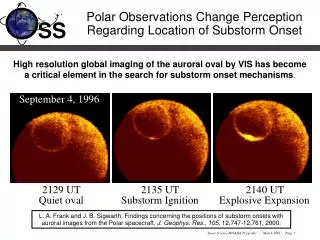
Cluster Observations on August 27 2001 Density (CODIF) Plasma b (CODIF) A B C Ion speed (HIA) [Vx, Vy, Vz] [Bx, By, Bz] Magnetic field magnitude Approximate substorm onset in global UV images at ~04:06-04:08 UT [Baker et al., GRL, 2002] Alfven Mach number Note: MA<1
Comparison with the Substorm of April 24 1979 Bx Bx sc1 sc3 Overview of ISEE 2 magnetic field (GSE) and plasma data near substorm onset. [Hones et al.,1986; Feldman et al., 1987] By By Bz Bz Pp beta Vx Vx
Comparison with the Plasmoid of April 24 1979 Cluster magnetic field hodogram (GSM) Three-dimensional magnetic field structure of plasmoid at substorm onset [from Hones et al., GRL, 1982].
Walen Analyses on August 27 2001(A) Tailward Region II Jets 04:00-04:03 UT sc1 • Positive Bx • Tailward jets • Prediction: Positive Region II Walen slope sc3
Walen Analyses on August 27 2001(B) Earthward Region I Jets 04:06-04:10 UT • Positive Bx • Earthward jets • Prediction: Negative Region I Walen slope sc1 04:06-04:08 UT sc3 04:09-04:10 UT
Walen Analyses on August 27 2001(C) Earthward Region I Jets 04:26-04:28 UT sc1 • Positive Bx • Earthward jets • Prediction: Negative Region I Walen slope sc3
A B C x: black y: green z: red Angle between V and B ….
Substorm of 27 August 2001 (B) (C)
Note on Importance of Density for the Walen Slope A mix of 5% O+ ions and 95% H+ results in an effective mass m=1.75mpand a lower Alfven speed, that effectivelyshould increase the Walen slope ….
Impact of m=mp Assumption O+ fraction: 0.8% - 4.8% Avg O+ fraction: 1.8% Walen slope=0.73 Assume 100% H+ Walen slope=0.65
Summary • The Walen test together with the location of Cluster north of the neutral sheet confirms the presence of a slow mode shock on the tailward side of the near-Earth X-line on August 27, 2001 that most likely accelerated the ions. • The Walen test for some earthward jets may indicate a correct slope (sign), although the quality of the HT frame is lower. • The earthward jets seem to be more field-aligned which implies that ideal MHD (and thus the HT analysis) breaks down. • The use of ion composition data from CODIF improved the Walen slope.