
Visual Data Mining: Unlocking Insights with Data Visualization
E N D
Presentation Transcript
Visual Data Mining: An Overview • What is Visual Data Mining? • Survey of techniques • Data Visualization • Visualizing Data Mining Results • Visual Data Mining
What Is Visual Data Mining? • Visual data mining “discovers implicit and useful knowledge from large data sets using data and/or knowledge visualization techniques” • Data visualization + Data mining techniques
Why Visual Data Mining? • Advantages of human visual system • Highly parallel processor • Sophisticated reasoning engine • Large knowledge base • Can be used to comprehend data distributions, patterns, clusters, and outliers
Why Not Only Visual Data Mining? • Disadvantages of human visual system • Needs training • Not automated • Intrinsic bias • Limit of about 106 or 107 observations (Wegman 1995) • Power of integration with analytical methods
Scope of Visual Data Mining • Visualization: Use of computer graphics to create visual images which aid in the understanding of complex, often massive representations of data • Visual Data Mining: The process of discovering implicit but useful knowledge from large data sets using visualization techniques Human Computer Interfaces Computer Graphics Multimedia Systems High Performance Computing Pattern Recognition
Purpose of Visualization • Gain insight into an information space by mapping data onto graphical primitives • Provide qualitative overview of large data sets • Search for patterns, trends, structure, irregularities, relationships among data • Help find interesting regions and suitable parameters for further quantitative analysis • Provide a visual proof of computer representations derived
Visual Data Mining & Data Visualization • Integration of visualization and data mining • data visualization • data mining result visualization • data mining process visualization • interactive visual data mining • Data visualization • Data in a database or data warehouse can be viewed • at different levels of abstraction • as different combinations of attributes or dimensions • Data can be presented in various visual forms
Visual Mining vs. Scientific Vis. & Graphics • Scientific Visualization • Often visualize physical model, low dimensionality • Graphics • More concerned with how to render (draw) rather than what to render
Data Visualization • View data in database or data warehouse • User may control • Different levels of details • Subset of attributes • Drawn using boxplots, histograms, polylines, etc.
Historical Overview of Exploratory Data Visualization Techniques(cf. [WB 95]) • Pioneering works of Tufte [Tuf 83, Tuf 90] and Bertin [Ber 81] focus on • Visualization of data with inherent 2D-/3D-semantics • General rules for layout, color composition, attribute mapping, etc. • Development of visualization techniques for different types of data with an underlying physical model • Geographic data, CAD data, flow data, image data, voxel data, etc. • Development of visualization techniques for arbitrary multidimensional data (w.o. an underlying physical model) • Applicable to databases and other information resources
Classification of Data Visualization Techniques • Geometric Techniques: • Scatterplots, Landscapes, Projection Pursuit, Prosection Views, Hyperslice, ParallelCoordinates... • Icon-based Techniques: • Chernoff Faces, Stick Figures, Shape-Coding, Color Icons, TileBars,... • Pixel-oriented Techniques: • Recursive Pattern Technique, Circle Segments Technique, Spiral- & Axes-Techniques,... • Hierarchical Techniques: • Dimensional Stacking, Worlds-within-Worlds,Treemap, Cone Trees, InfoCube,... • Graph-Based Techniques: • Basic Graphs (Straight-Line, Polyline, Curved-Line,...) • Specific Graphs (e.g., DAG, Symmetric, Cluster,...) • Systems (e.g., Tom Sawyer, Hy+, SeeNet, Narcissus,...) • Hybrid Techniques: arbitrary combinations from above
Distortion & Dynamic/Interaction Techniques • Distortion Techniques • Simple Distortion (e.g. Perspective Wall, Bifocal Lenses, TableLens, Graphical Fisheye Views,...) • Complex Distortion (e.g. Hyperbolic Repr. Hyperbox,...) • Dynamic/Interaction Techniques • Data-to-Visualization Mapping (e.g. Auto Visual, S Plus, XGobi, IVEE,...) • Projections: (e.g. GrandTour, S Plus, XGobi,...) • Filtering (Selection, Querying) (e.g. MagicLens, Filter/Flow Queries, InfoCrystal,...) • Linking & Brushing (e.g. Xmdv-Tool, XGobi, DataDesk,...) • Zooming (e.g. PAD++, IVEE, DataSpace,...) • Detail on Demand (e.g. IVEE, TableLens, MagicLens, VisDB,...)
Visual Survey • Data visualization techniques • Scatterplot Matrices, Landscapes, Parallel Coordinates • Icon-based, Dimensional Stacking, Treemaps
Direct Visualization Ribbons with Twists Based on Vorticity
Geometric Techniques • Basic Idea • Visualization of geometric transformations and projections of the data • Methods • Landscapes [Wis 95] • Projection Pursuit Techniques [Hub 85] (a techniques for finding meaningful projections of multidimensional data) • Scatterplot-Matrices [And 72, Cle 93] • Prosection Views [FB 94, STDS 95] • Hyperslice [WL 93] • Parallel Coordinates [Ins 85, ID 90]
Scatterplot-Matrices [Cleveland 93] Used byermission of M. Ward, Worcester PolytechnicInstitute matrix of scatterplots (x-y-diagrams) of the k-dimensional data [total of (k2/2-k) scatterplots]
Landscapes [Wis 95] • Visualization of the data as perspective landscape • The data needs to be transformed into a (possibly artificial) 2D spatial representation which preserves the characteristics of the data news articlesvisualized asa landscape Used by permission of B. Wright, Visible Decisions Inc.
Parallel Coordinates [Ins 85, ID 90] • n equidistant axes which are parallel to one of the screen axes and correspond to the attributes • the axes are scaled to the [minimum, maximum]―range of the corresponding attribute • every data item corresponds to a polygonal line which intersects each of the axes at the point which corresponds to the value for the attribute
Icon-Based Techniques • Basic Idea • Visualization of the data values as features of icons • Overview • Chernoff-Faces [Che 73, Tuf 83] • Stick Figures [Pic 70, PG 88] • Shape Coding [Bed 90] • Color Icons [Lev 91, KK 94] • TileBars [Hea 95](use of small icons representing the relevance feature vectors in document retrieval)
Stick Figures census data showing age, income, sex, education, etc. used by permission of G. Grinstein, University of Massachusettes at Lowell
Hierarchical Techniques • Basic Idea: Visualization of the data using a hierarchical partitioning into subspaces. • Overview • Dimensional Stacking [LWW 90] • Worlds-within-Worlds [FB 90a/b] • Treemap [Shn 92, Joh 93] • Cone Trees [RMC 91] • InfoCube [RG 93]
Dimensional Stacking [LWW 90] • partitioning of the n-dimensional attribute space in 2-dimensional subspaces which are ‘stacked’ into each other • partitioning of the attribute value ranges into classes the important attributes should be used on the outer levels • adequate especially for data with ordinal attributes of low cardinality
Dimensional Stacking • Used by permission of M. Ward, Worcester Polytechnic Institute Visualization of oil mining data with longitude and latitude mapped to the outer x-, y-axes and ore grade and depth mapped to the inner x-, y-axes
Dimensional Stacking • Disadvantages: • Difficult to display more than nine dimensions • Important to map dimensions appropriately • May be difficult to understand visualizations at first
Treemap [JS 91, Shn 92, Joh 93] • Screen-filling method which uses a hierarchical partitioning of the screen into regions depending on the attribute values • The x- and y-dimension of the screen are partitioned alternately according to the attribute values (classes) MSR Netscan image:
Treemaps • The attributes used for the partitioning and their ordering are user-defined (the most important attributes should be used first) • The color of the regions may correspond to an additional attribute • Suitable to get an overview over large amounts of hierarchical data (e.g., file system) and for data with multiple ordinal attributes (e.g., census data)
Data Mining Result Visualization • Presentation of the results or knowledge obtained from data mining in visual forms • Examples • Scatter plots and boxplots (obtained from descriptive data mining) • Decision trees • Association rules • Clusters • Outliers • Generalized rules • Text mining
Visualization of Data Mining Results in SAS Enterprise Miner: Scatter Plots
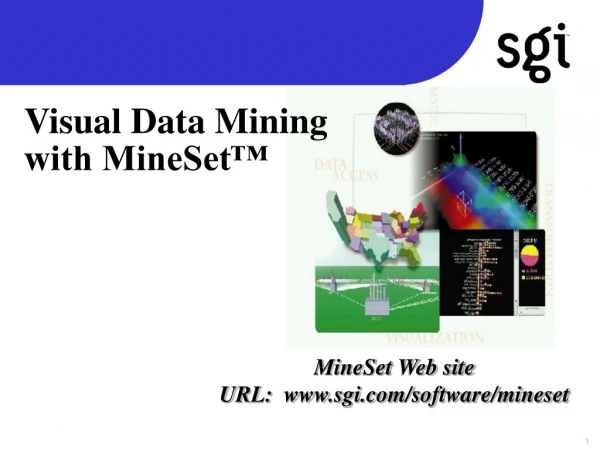
Association Rules (MineSet) • LHS and RHS items are mapped to x-, y-axis • Confidence, support correspond to height of the bar or disc, respectively • Interestingness is mapped to Color
Association Ball Graph (DBMiner) • Items are visualized as balls • Arrows indicate rule implication • Size represents support
Classification (SAS EM [SAS 01]) • Color corresponds to relative frequency of a class in a node • Branch line thickness is proportional to the square root of the objects Tree Viewer
Cluster Analysis(H-BLOB: Hierarchical BLOB) [SBG 00] Form blobs (implicit surfaces) Cluster Form ellipsoids
Text Mining (ThemeRiver [WCF+ 00]) • Visualization of thematic Changes in documents • Vertical distance indicates collective strength of the themes
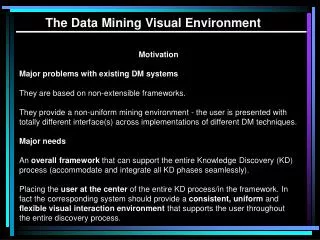
Data Mining Process Visualization • Presentation of the various processes of data mining in visual forms so that users can see the flow of data cleaning, integration, preprocessing, mining • Data extraction process • Where the data is extracted • How the data is cleaned, integrated, preprocessed, and mined • Method selected for data mining • Where the results are stored • How they may be viewed
Visualization of Data Mining Processes by Clementine See your solution discovery process clearly Understand variations with visualized data
Interactive Visual Data Mining • Using visualization tools in the data mining process to help users make smart data mining decisions • Example • Display the data distribution in a set of attributes using colored sectors or columns (depending on whether the whole space is represented by either a circle or a set of columns) • Use the display to which sector should first be selected for classification and where a good split point for this sector may be
Visual data mining • Projection Pursuits • (Class) Tours [Dhillon et al. ’98] • Visual Classification [Ankerst et al. KDD ’99]
Projection Pursuits • Exploratory projection pursuit: • Goal: reduce dimensionality • Define “interestingness” index to each possible projection of a data set • Maximize this index, project linearly • Not always possible/useful