Download
1 / 1
10 likes | 119 Vues
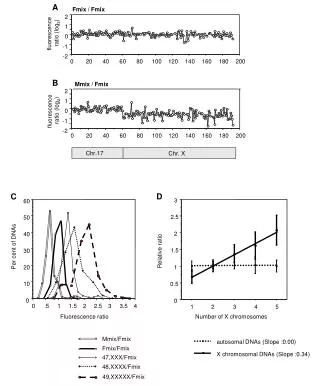
This study explores the fluorescence ratios of various chromosomal DNA samples, focusing on the comparative analysis between Mmix and Fmix across autosomal and X chromosomal DNAs. Key metrics include relative ratios, percentages of DNA samples, and slopes of fluorescence ratios. The research incorporates data from chromosomes 17 and X, providing insights into the ratios observed in different numerical variants such as 47,XXX, 48,XXXX, and 49,XXXXX. The findings offer critical implications for understanding chromosomal abnormalities and their fluorescence characteristics.

E N D
60 50 40 30 20 10 0 0 1 2 3 .5 1.5 2.5 3.5 4 A Fmix / Fmix 2 1 fluorescence ratio (log2) 0 -1 -2 0 20 40 60 80 100 120 140 160 180 200 B Mmix / Fmix 2 1 fluorescence ratio (log2) 0 -1 -2 0 20 40 60 80 100 120 140 160 180 200 Chr.17 Chr. X D C 3 2.5 2 Per cent of DNAs 1.5 Relative ratio 1 0.5 0 1 2 3 4 5 Fluorescence ratio Number of X chromosomes Mmix/Fmix autosomal DNAs (Slope :0.00) Fmix/Fmix X chromosomal DNAs (Slope :0.34) 47,XXX/Fmix 48,XXXX/Fmix 49,XXXXX/Fmix