Download
1 / 44
440 likes | 548 Vues
Explore the journey from gene expression profiling to mapping genetic variations and back again, illuminating natural mutation insights. This talk covers topics like Natural Variation in Light Response, Spatial Correction, Bulk Segregant Mapping, and Chromosome Haplotype Analysis. Discover the power of Single Feature Polymorphisms (SFPs) in identifying potential deletions and gene clusters like Disease Resistance (R) and FLOWERING1 QTL. Gain insights into Extreme Array Mapping and Array Haplotyping for deep population structure analysis and gene discovery. Unveil the secrets of MicroArray Evolution in unraveling genetic mysteries!

E N D
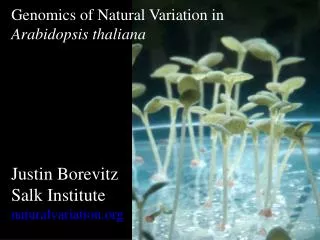
MicroArray Evolution:expression to mapping and back again Justin BorevitzSalk Institutenaturalvariation.org MicroArray Evolution:expression to mapping and back again Justin BorevitzSalk Institutenaturalvariation.org
Talk Outline • Natural Variation in Light Response • Transcriptional profiling • for QTL candidate genes • Single Feature Polymorphisms (SFPs) • Potential deletions • Bulk Segregant Mapping • Extreme Array Mapping • Haplotype analysis • Expression Revisited
Natural Mutation in PHYA photoreceptor Natural Mutation in PHYA photoreceptor
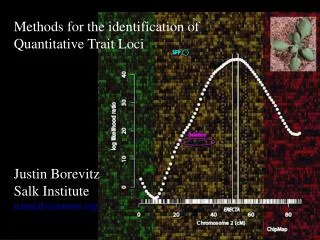
Quantitative Trait Loci EPI1 EPI2
What is Array Genotyping? • Affymetrix expression GeneChips contain 202,806 unique 25bp oligo nucleotides. • 11 features per probset for 21546 genes • New array’s have even more • Genomic DNA is randomly labeled with biotin, product ~50bp. • 3 independent biological replicates compared to the reference strain Col GeneChip
Spatial Correction Improved reproducibility Next: Quantile Normalization Spatial Artifacts
False Discovery and Sensitivity PM only GeneChip SAM threshold SFPs nonSFPs Cereon marker accuracy 5% FDR 3806 89118 100% Sequence 817 121 696 Sensitivity Polymorphic 340 117 223 34% Non - polymorphic 477 4 473 False Discovery rate: 3% Test for independence of all factors: value = 1.845e Chisq = 177.34, df = 1, p - - 40 real data Observed t statistics vs Null (permuted) t statistics 5% FDR Permuted data
Chip genotyping of a Recombinant Inbred Line 29kb interval Discovery 6 replicates X $500 12,000 SFPs = $0.25 Typing 1 replicate X $500 12,000 SFPs = $0.041
Potential Deletions >500 potential deletions 45 confirmed by Ler sequence 23 (of 114) transposons Disease Resistance (R) gene clusters Single R gene deletions Genes involved in Secondary metabolism Unknown genes
FLOWERING1 QTL deletion of MAF1 MAF1 Flowering Time QTL caused by a natural deletion in MAF1 Potential Deletions Suggest Candidate Genes Chr1 (bp)
Fast Neutron deletions FKF1 80kb deletion CHR1 cry2 10kb deletion CHR1
100 bibb mutant plants Map bibb 100 wt mutant plants
bibb mapping Bulk segregant Mapping using Chip hybridization bibb maps to Chromosome2 near ASYMETRIC LEAVES1 AS1 ChipMap
BIBB = ASYMETRIC LEAVES1 AS1 (ASYMMETRIC LEAVES1) = MYB closely related to PHANTASTICA located at 64cM as1 bibb Sequenced AS1 coding region from bib-1 …found g -> a change that would introduce a stop codon in the MYB domain bib-1 W49* as-101 Q107* bibb as1-101 MYB
Chromosome 2 16 12 RED2 QTL LOD 8 4 0 0 20 40 60 80 100 cM RED2 QTL 12cM Composite Interval Mapping eXtreme Array Mapping LOD 15 tallest RILs pooled vs 15 shortest RILs pooled QTL likelihood model using bulk segregant analysis with SFP genotyping Red light QTL RED2 from 100 Kas/ Col RILs
Simulation Likelihood 50 eXtreme of 500 F2s chr2 QTL 37% var chr5 QTL 13% var Can detect additive or epistatic QTL but hard to determine which
Fine Mapping with Arrays Single Additive Gene 1000 F2s Select recombinants by PCR 1Mb region
Array Haplotyping • What about Diversity/selection across the genome? • A genome wide estimate of population genetics parameters, θw, π, Tajima’D, ρ • LD decay, Haplotype block size • Deep population structure? • Col, Lz, Ler, Bay, Shah, Cvi, Kas, C24, Est, Kin, Mt, Nd, Sorbo, Van, Ws2
Array Haplotyping • Hybridize 48 arrays with 15 accessions • 3 replicates • Analyze 1/10 Genome 12Mb • 24,507 features x 14 = 343,098 T-tests • Spatial Correction, quantile normalization, SAM like T-tests, permutation null distribution.
Chromosome1 ~500kb Col Ler Cvi Kas Bay Shah Lz Nd Array Haplotyping Inbred lines Low effective recombination due to partial selfing Extensive LD blocks
Distribution of T-stats 208,729 null (permutation) actual 32,427 Calls Not Col NA Col NA duplications 12,250 SFPs
Complete Genome Tiling Chip 1st Set 25 bp 25 bp 8 bp 25 bp 25 bp 2nd Set 16 bp 25 bp 25 bp 3rd Set Extra Chips: 9 Whole-Genome Expression Chips 2 Splicing Chips 2 5’ Mapping Chips New Gene Discovery Improve Annotation Alternative Splicing Micro RNAs ChIP – Chip (DNA binding sites) Polymorphisms (re-sequencing) Global methylation (Methylome) Comparative Genomics (Brassica) Validate features
ChipViewer: Mapping of transcriptional units of ORFeome From 2000v At1g09750 (MIPS) to the latest AGI At1g09750 2000 v Annotation (MIPS) The latest AGI Annotation
Expression Analysis Revisited Feature level model Gene Expression index that accounts for feature effect and polymorphisms FLC controls flowering time Difference detected it 3 day old seedlings
PAG1 down regulated in Cvi PLALE GREEN1 knock out has long hypocotyl in red light
Review • Transcriptional profiling to identify candidate genes and downstream responses that consider polymorphisms • Single Feature Polymorphisms (SFPs) can be used to identify recombination breakpoints, potential deletions, for eXtreme Array mapping, and haplotyping
Salk Jon Werner Todd Mockler Sarah Liljegren Joanne Chory Detlef Weigel Joseph Ecker UC Davis Julin Maloof UC San Diego Charles Berry Scripps Sam Hazen Elizabeth Winzeler Salk Jon Werner Todd Mockler Sarah Liljegren Joanne Chory Detlef Weigel Joseph Ecker UC Davis Julin Maloof UC San Diego Charles Berry Scripps Sam Hazen Elizabeth Winzeler NaturalVariation.org NaturalVariation.org Syngenta Hur-Song Chang Tong Zhu Syngenta Hur-Song Chang Tong Zhu University of Guelph, Canada Dave Wolyn University of Guelph, Canada Dave Wolyn
Effect of SNP position 340 Candidate Polymorphisms False negative True Positive
Fine Mapping LIGHT1 2nd North QTL 500kb
Future Projects Design 2nd generation expression array $200 350,000 25mer features, expect 12,000 SFPs (2 accessions) Validated gene models (exon intron) 2 features per exon, alternative splicing 5’ 3’ Untranslated region for gene family/ polymorphism Micro RNAs Validated “good” hybridization intensities
Haplotype Map – 20 Accessions 3 replicates, SFP discovery estimated 85,000 SFPs 1.4kb resolution Association Studies – 120 Accessions 1 replicate, Genotyping Bulk Segregant Mapping – Confirm Associations in specific crosses Future Projects DNA
True natural variation in gene expression 20 Accessions 3 replicates, (polymorphism accounted for) Cis regulatory variation/ Imprinting reciprocal F1s 3 replicates Transcriptome QTL Map – 100 best VanC Advanced Intercross Lines How many loci control the variation in gene transcription? Candidate TF and binding sites? Future Projects RNA