Segmentation (continued)
Learn about clustering, K-means, probabilistic clustering, graph-based segmentation, graph cuts, normalized cuts, and advanced methods like Active Contour Models. Explore practical applications and key algorithms in image segmentation.

Segmentation (continued)
E N D
Presentation Transcript
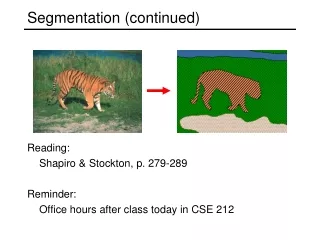
Segmentation (continued) • Reading: • Shapiro & Stockton, p. 279-289 • Reminder: • Office hours after class today in CSE 212
Clustering • Segmenting images by pixel color • This is a clustering problem! • Objective • Each point should be as close as possible to a cluster center • Minimize sum squared distance of each point to closest center
Break it down into subproblems • Suppose I tell you the cluster centers ci • Q: how to determine which points to associate with each ci? • A: for each point p, choose closest ci • Suppose I tell you the points in each cluster • Q: how to determine the cluster centers? • A: choose ci to be the mean of all points in the cluster
K-means clustering • K-means clustering algorithm • Randomly initialize the cluster centers, c1, ..., cK • Given cluster centers, determine points in each cluster • For each point p, find the closest ci. Put p into cluster i • Given points in each cluster, solve for ci • Set ci to be the mean of points in cluster i • If ci have changed, repeat Step 2 • Java demo: http://home.dei.polimi.it/matteucc/Clustering/tutorial_html/AppletKM.html • Properties • Will always converge to some solution • Can be a “local minimum” • does not always find the global minimum of objective function:
Probabilistic clustering • Basic questions • what’s the probability that a point x is in cluster m? • what’s the shape of each cluster? • K-means doesn’t answer these questions • Basic idea • instead of treating the data as a bunch of points, assume that they are all generated by sampling from a probability distribution • This is called a generative model • defined by a vector of parameters θ
Mixture of Gaussians • One generative model is a mixture of Gaussians (MOG) • K Gaussian blobs with means μb covariance matrices Vb, dimension d • blob b defined by: • blob b is selected with probability • the likelihood of observing x is a weighted mixture of Gaussians • where
Expectation maximization (EM) • Goal • find blob parameters θthat maximize the likelihood function: • Approach: • E step: given current guess of blobs, compute ownership of each point • M step: given ownership probabilities, update blobs to maximize likelihood function • repeat until convergence
Graph-based segmentation • What if we look at relationships between pixels?
Images as graphs • Fully-connected graph • node for every pixel • link between every pair of pixels, p,q • cost cpq for each link • cpq measures similarity • similarity is inversely proportional to difference in color and position q Cpq c p
w Segmentation by Graph Cuts • Break Graph into Segments • Delete links that cross between segments • Easiest to break links that have low cost (low similarity) • similar pixels should be in the same segments • dissimilar pixels should be in different segments A B C
Cuts in a graph • Link Cut • set of links whose removal makes a graph disconnected • cost of a cut: B A • Find minimum cut • gives you a segmentation • fast algorithms exist for doing this
Cuts in a graph B A • Normalized Cut • a cut penalizes large segments • fix by normalizing for size of segments • volume(A) = sum of costs of all edges that touch A
Interpretation as a Dynamical System • Treat the links as springs and shake the system • elasticity proportional to cost • vibration “modes” correspond to segments • can compute these by solving an eigenvector problem • for more details, see • J. Shi and J. Malik, Normalized Cuts and Image Segmentation, CVPR, 1997
More on Segmentation • Active Contour Models • Kass et al. 1988 • Markov Random Fields • Boykov et al. 2001 • Mean Shift • Comaniciu and Meer 2002
Mean Filtering with Integral Images • Integral Image (or summed-area table) • Precomputation: O(n) • Sum over rectangle: O(1) (a,b) (c,d)
Matlab code • function B = meanfilt(A,k) • [m n] = size(A); • p1 = ceil(k/2); • p2 = floor(k/2); • P = zeros(m+k-1,n+k-1); • P(p1:end-p2,p1:end-p2) = A / (k*k); • S = cumsum(P,1); • S = cumsum(S,2); • B = S(k:end,k:end) • – S(1:end-k+1,k:end) • - S(k:end,1:end-k+1) • + S(1:end-k+1,1:end-k+1);