Download
1 / 13
170 likes | 576 Vues
Economies of Scale. Chapter 13 completion. When MC < ATC => average total cost is falling When MC > ATC => average total cost is rising. ATC is U-shaped Due to high fixed costs. MC. AFC always declines: Fixed Costs spread over more output. ATC. AVC. AFC.

E N D
Economies of Scale Chapter 13 completion
When MC < ATC => average total cost is falling • When MC > ATC => average total cost is rising ATC is U-shaped Due to high fixed costs MC AFCalways declines: Fixed Costs spread over more output ATC AVC AFC The Shape of Cost Curves Note how MC hits both ATC & AVC at their minimum Costs $3.00 2.50 2.00 1.50 1.00 0.50 0 2 4 6 8 10 12 14 Quantity of Output
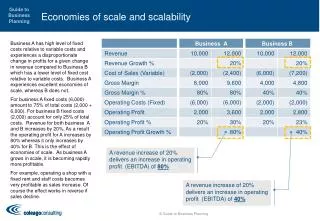
Finding Economic Profit There are several formulas to calculate profit: 1) Profit = TR – TC 2) Profit = (Price – ATC) X Qty (most useful formula) Market Price = P1 If P1 > ATC => Economic Profit If P1 < ATC => Economic Loss
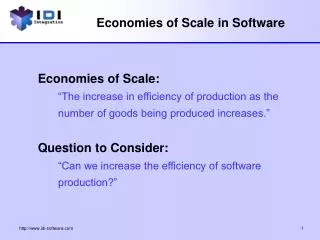
Economies of Scale • Economies of scale- • ATC falls as output increases • Allows for specialization of workers • Leads to more productivity per worker • Diseconomies of scale- • ATC rises as output increases • coordination problems eventually arise as firms grow in size • Constant returns to scale- • ATC stays the same as output increases
Short Run vs. Long Run Costs • Costs depends on the time horizon considered • In the short run, some costs are fixed • In the long run, allfixed costsbecome variable costs • Why: Firms have time to change both plant size & labor force • Therefore, long-run cost curves differ from short-run cost curves
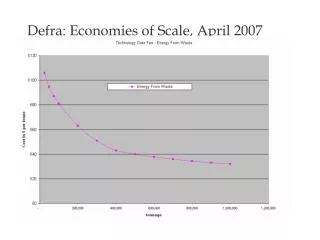
$12,000 10,000 Constant Economies returns to of Diseconomies scale scale of scale 1,000 1,200 Long Run ATC Average Total Note! => The “term” economies of scale applies only to long run cost curves Cost LRATC Quantity of 0 Cars per Day
Long Run vs. Short Run ATC • LRATC is always below or on short run ATC curve • you can be more efficient in long run!
Products CONSUMERS Circular Flow PRODUCERS Land, Labor & Capital Factors Reasons to LOVE Wal-Mart Keeps prices very low Saved consumer 20 billion a year Overall, may save 100 billion per year This Lowers inflation and↑ GDP
Reasons to HATE Wal-Mart Keeps wages low Puts local companies out of business Accused of “abusing” worker rights Predatory Pricing?
Cost Curves for a Typical Firm MC declines & then increases (diminishing marginal product) Costs $3.00 2.50 MC 2.00 1.50 ATC AVC 1.00 0.50 AFC 0 2 4 6 8 10 12 14 Quantity of Output
Price/ Costs Quantity