Curvilinear Regression
This study explores the effectiveness of polynomial regression models in the context of a monotonic relationship between variables X and Y. By applying polynomial transformations, we improve predictions for various datasets, including calorie consumption based on meal attendance and the phototactic behaviors of ladybugs in response to temperature changes. We evaluate different polynomial models (linear, quadratic, cubic, quartic) and assess the significance of adding predictors, guiding readers on model selection based on R² increases. The analysis emphasizes the balance between model complexity and predictive accuracy.


Curvilinear Regression
E N D
Presentation Transcript
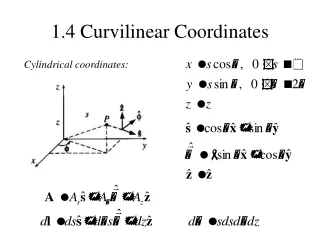
Monotonic but Non-Linear • The relationship between X and Y may be monotonic but not linear. • The linear model can be tweaked to take this into account by applying a monotonic transformation to Y, X, or both X and Y. • Predicting calories consumed from number of persons present at the meal.
Calories Log Model Persons
Aggregation of Ladybugs • A monotonic transformation will not help here. • A polynomial regression will. • Copp, N.H. Animal Behavior, 31, 424-430 • Subjects = containers, each with 100 ladybugs • Y = number of ladybugs free (not aggregated) • X = temperature
Polynomial Models • Quadratic: • Cubic: • For each additional power of X added to the model, the regression line will have one more bend.
Using Copp’s Data • Compute Temp2, Temp3 and Temp4. • Conduct a sequential multiple regression analysis, entering Temp first, then Temp2, then Temp3, and then Temp4. • At each step, evaluate whether or not the last entered predictor should be retained.
SAS • Curvi -- Polynomial Regression, Ladybugs. • Download and run the program. • Refer to it and the output as Professor Karl goes over the code and the output
Which Model to Adopt? • Adding Temp2 significantly increased R2, by .838-.615 = .223, keep Temp2. • Adding Temp3significantly increased R2, by .861-.838 = .023 – does this justify keeping Temp3? • Adding Temp4 did not significantly increase R2. • Somewhat reluctantly, I went cubic.
Phototaxis • Subjects = containers, each with 100 ladybugs • Containers lighted on one side, dark on the other • Y = number on the lighted side • X = temperature
R2 Linear = .137 Quadratic = .601
The Quadratic Model • The quadratic model clearly fits the data better than does the linear model. • Phototaxis is positive as temps rise to about 18 and negative thereafter.
A Cubic Model • R2 has increased significantly, from .601 to .753, p < .001 • Does an increase of 15.2% of the variance justify making the model more complex? • I think so.
Interpretation • Ladybugs buried in leaf mold in Winter head up, towards light, as temperatures warm. • With warming beyond 12, head for some shade – the aphids are in the shade under Karl’s tomato plant leaves. • With warming beyond 32, this place is too hot, lets get out of here.
A Quartic Model • R2=.029, p = .030 • Does this small increase in R2 justify making the model more complex? • Can you make sense of a third bend in the curve.
The quartic plot does not look much different than the cubic.
Multicollinearity • May be a problem whenever you have products or powers of predictors in the model. • Center the predictor variables, • Or simply standardize all variables to mean 0, standard deviation 1.