Download
1 / 28
280 likes | 308 Vues
Delve into the fusion of art and science through aesthetic data representation in information visualization, sparking inspiration and user engagement. Discover case studies and challenges in the realm of creative data visualization.

E N D
SIMS 247: Information Visualization and Presentationjeffrey heer Visualization and the Arts Nov 28, 2005
today • overview • art, science, engineering, design • aesthetics • case studies • ambient infovis • artifacts of the presence era • online examples • “playful visualization”
Pure Science Art Technical Humanistic “Minds” “Molecules” Engineering Design Applied c.f. Rich Gold, PARC
Science Art InfoVis? Engineering Design
Science Art or Info Vis? Engineering Design
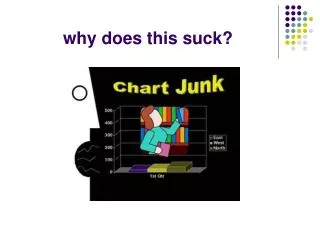
“Top 10 Unsolved Information Visualization Problems” • Problem 7: Aesthetics. The purpose of information visualization is the insights into data that it provides, not just pretty pictures. But what makes a picture pretty? What can we learn from making a pretty picture and enhancing the representation of insights? It’s important, therefore, to understand how insights and aesthetics interact, and these two goals could sustain insightful and visually appealing information visualization. • Chaomei Chen
Aesthetics == Pretty Pictures? • Reactions? • My own (somewhat half-baked) thoughts… • Affective engagement. • Increased interest and prolonged use due to positive emotional experience. • Inspiration. • Inspire new thoughts or approaches through creative presentation. • Denotation vs. Connotation. • Not just what is portrayed, but how it is portrayed can meaningfully communicate.
Aesthetics • Aesthetic - tending to stimulate or enliven the senses. • Or, in contrast, • Anaesthetic - tending to dull the senses or cause sleepiness.
Motivation for aesthetic visualization • End-user adoption of information visualization • Moving beyond scenarios of dedicated analysts • (or alternatively, more inspiring and domain-embedded solutions for said analysts) • Visualization off-of-the-desktop • The role of visualization in “ubiquitous computing” • Determining the relative importance of design constraints beyond “cognitive bandwidth” • Exploration of new media and visualization techniques for artistic expression
Case Studies • Examples to reflect on • Not being upheld as either good or bad • Given lack of tested evaluation approaches, this remains largely subjective • Still, put on your critical hat as we step through these… • What works? What doesn’t? • What do we walk away with that can improve design?
Designing Ambient Visualizations skog, ljungblad, holmquist; viktoria institute • Ambient displays • Information displays embedded in “everyday” environments • Need for aesthetics and non-intrusiveness (“calm” technology) in addition to communicative potential • Use of artistic “templates”, in this case Piet Mondrian’s “De Stijl” • Constrain design to a particular style
size: temperature color: sunny, raining, cloudy position: geography weather information about six major cities
size: time until departure color: lots of time, leave now, hurry! position: bus direction bus schedule information
User Testing Results • Three Questions 1. Do you know that data is being visualized? 2. What data is being visualized? 3. Can you read the visualization? • Results • 1/6 answered “No” to Q1 • Other 5/6 answered “Yes” to Q1 and Q2 • Of those 2 answered “No” to Q3
Lessons Learned (paraphrased) • 1: Optimize the relevance of information to the people at the site of installation. • 2: Rate of information change should be frequent enough to be relevant, but changes need to be carefully designed • 3: Artistic templates need not hinder, and may aid, readability and comprehension. • 4: Let features of the underlying information affect the visual encoding (i.e., exploit domain specific features) • Your thoughts?
Artifacts of the Presence Area viegas et al; mit media lab • “Using Information Visualization to Create an Evocative Souvenir” • Goal: to design a commemorative, historical record of the passage of time inside a museum. • Aesthetically compelling presentation • Highlight long-term temporal patterns • Apply the metaphor of geological layering • Use of visualization technology not to analyze large data collections, but to serve as a catalyst for memory.
Artifacts of the Presence Era • Sample audio in the museum space • Use shape of audio wave to determine shape of “layer” • Louder times are larger • Layer onto the current stack • Cut out a corresponding part of the video image • As the stack grows, “pressure” causes older entries to compress, and even morph together
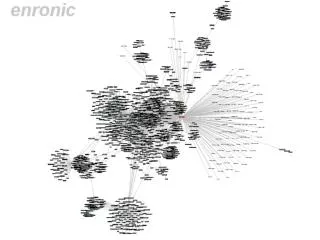
Subsequent work: Mountain fernanda viegas – moutain of e-mail conversations
Online Examples • WordCount / QueryCount (Jonathan Harris) • http://www.wordcount.org/ • The Secret Lives of Numbers (Golan Levin) • http://www.turbulence.org/Works/nums/ • Genomic Cartography (Ben Fry) • http://acg.media.mit.edu/people/fry/genocarto.html • Processing Exhibition • http://processing.org/exhibition/ • Whitney Artport • http://artport.whitney.org/
Related Idea – “Playful Visualization” • Data exploration re-cast as a “playful” rather than “analytic” behavior. • (while, in fact, it should hopefully be both) • Visualizations become “public” places facilitating social interaction and play, which in turn hopefully stimulates both personal and group exploration to unearth insight. • Generating personal insight into a data set • Harnessing “social data analysis” to effectively “open source” data mining.
Vizster findings • Exploration was framed as social play. • Hunting for friends and acquaintances. • Groups spent more time in front of the visualization than individuals. • People who couldn’t find their own profile spent the least time of all. • Visualization usage elicited social narratives. • Users engaged in stories, conversation, and social bonding in response to visualization. • Visualization as ethnographic tools.
NameVoyager Findings • “Unexpected” interest in the data • “…by the way, I don’t like babies or children.” • Analysis as social activity • Pattern-finding challenges carried out on blogs • “dialogue, one-upmanship, and repartee” • Applied Bartle’s characterization of online multiplayer game players • Achievers, Socializers, Explorers, Killers
How to design for playfulness? • What lessons can we take away to attempt purposeful design of such visualizations?
Preliminary Hypotheses • Personal connection to the data • Personal relevance or interest in the data • Personal points of entry into data sets • Facilitate communication and sharing • Pointers/links into the data • Easy to reach particular states • Make people’s activity visible • Annotation, or “planting your flag” on discovered data • “Subversion” of intended purpose • Finding the boundary cases • The “Explorers” and “Killers” roles
Looking towards the future • Different opinions / perspectives • Formalizing design • Developing design guidelines and evaluation criteria, extending into aesthetic criteria. • Separatist approaches • Let artists/designers develop “templates” that engineers can then apply without focusing about aesthetics, maintaining domain specialization • Improved tools can encapsulate the engineering legwork into abstractions designers can work with. • Integrated approaches • The necessary marriage of design and engineering practices?
“Top 10 Unsolved Information Visualization Problems” • Problem 7: Aesthetics. … It’s important, therefore, to understand how insights and aesthetics interact … • Chaomei Chen • Any thoughts on what this entails, and how it might be achieved? • How to evaluate aesthetic response? • How to characterize aesthetic interaction on the process of insight?