Estimation in Stratified Random Sampling
Estimation in Stratified Random Sampling. (Session 07). Learning Objectives. By the end of this session, you will be able to explain what is meant by stratification, how a stratified sample is drawn, and its advantages

Estimation in Stratified Random Sampling
E N D
Presentation Transcript
Estimation in Stratified Random Sampling (Session 07)
Learning Objectives By the end of this session, you will be able to • explain what is meant by stratification, how a stratified sample is drawn, and its advantages • explain proportional or Neyman’s allocation of sample sizes to each stratum • compute estimates of the population mean and population total from results of a stratified random sample • determine measures of precision for the above estimates
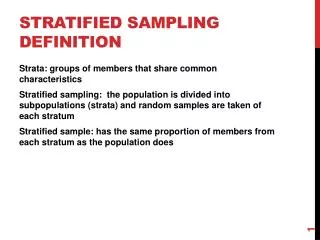
Review of stratified sampling • We recall first that stratification is done when it is possible to divide the population into groups (strata) so that the within group variance is small, ideally as small as possible. • From each stratum, a sample of suitable size is drawn, usually using simple random sampling. • The greatest challenge is in defining a suitable stratification variable. • It is useful when information is required for each stratum (e.g. each region in a country) as well as for the whole population.
Advantages of stratification • Sampling from each stratum guarantees that the overall sample is more representative of the whole population compared to a simple random sample • If each stratum is more homogeneous, i.e. less variable than the population as a whole with respect to key responses of interest, then estimates will be more precise • Likely to be administratively convenient, e.g. when different sampling procedures need to be applied to different strata (see ELUS example in Practical 2 for large sized estates of >500ha)
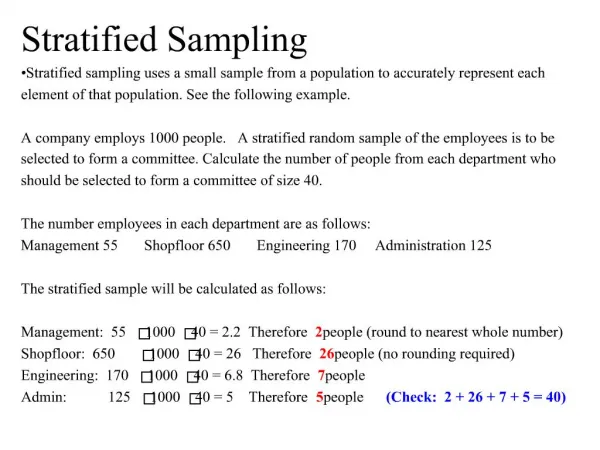
Sampling with proportional allocation • Suppose there are m strata and a sample of size ni is chosen from the Ni units in stratum i. • Then total population size is N = Ni , while the sample size is n = ni . • Often convenient to choose ni so that • This is called proportional allocation
Sampling using Neyman’s allocation • If costs of sampling are the same in each stratum, but variability is different (although homogeneous within strata), then sensible to take more samples where there is greater variability, i.e. sample in proportion to the standard deviation. • The appropriate value of ni in this case, see below, is called Neyman’s (or optimum) allocation.
Other issues and allocation methods • Above assumes within-stratum variances Si are known. A pilot run or a previous study may give estimates. • But results from a pilot run may give very poor estimates, since they will often be based on very small sample sizes • Also note that Neyman’s allocation may lead to very few units being sampled from some strata – not useful if separate results for each stratum are also needed. • Other methods of allocation exists, e.g. incorporating possible differences in sampling costs
Estimating the population mean • First carry out computations for each stratum, i.e. find mean and variance for ith stratum. • The estimate the population mean is then , with variance
Estimating the population total • As with the mean, first find an estimate for the total in ith stratum, i.e. • The estimate the population total is then , with variance Note: Use expressions on the previous page in computing these estimates
An example Government agricultural inspectors carry out a survey of cattle ownership in a region divided into 3 administrative areas. Five farms are selected from each area and the number of cattle recorded as shown below. The total number of farms is 636.
Questions to answer What is the mean number of cattle per farm? What is the total number of cattle in the region? First need to compute some summaries: Note: fi = ni/Ni in ith stratum.
Answers for estimating mean The mean number of cattle per farm is estimated as: = 16547.2/636 = 26.02 i.e. Approximately 26 cows per farm. This has variance: = 25.031 Hence its std. error = 5.0
Answers for estimating total • The total number of cattle in the region is estimated as: = 636 x 26.02 = 16547 This has variance: = (636)2 x 25.031 Hence its standard error is 636 x 25.031 = 3181.9
Estimating population proportion • As with the mean, first find an estimate for proportion in ith stratum, i.e. pi = ri/ni • The estimate the population proportion is then , with variance
References Barnett, V. (1974) Elements of Sampling Theory. Edward Arnold. ISBN 0 340 17387 4 Levy, P.S. and Lemeshow, S. (1999) Sampling and Populations: Methods and Applications(3rd edition) Wiley, New York. ISBN 0-471-15575-6 Lohr, S.L. (1999) Sampling: Design and Analysis. International Thomson Publishing. ISBN 0-534-35361-4